
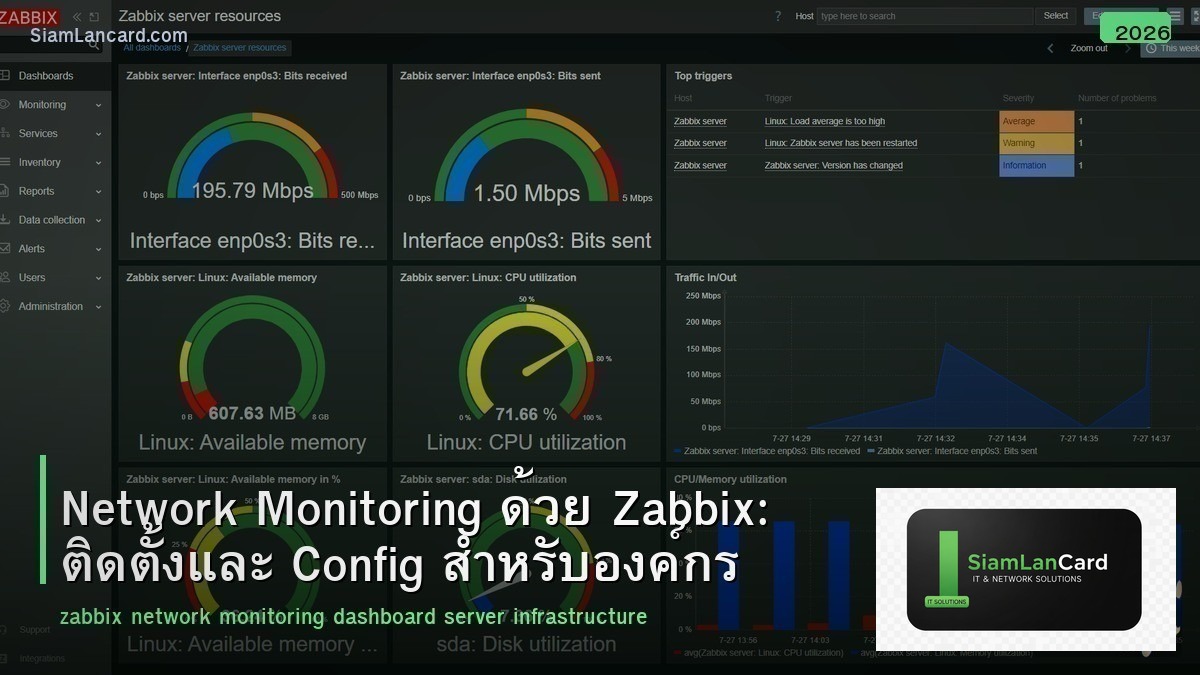
Network Monitoring ด้วย Zabbix: ติดตั้งและ Config สำหรับองค์กร
Zabbix เป็น open-source enterprise monitoring platform ที่ใช้ monitor servers, network devices, applications และ cloud services ได้ครบจบในตัวเดียว รองรับ SNMP, IPMI, JMX, agents และ custom scripts สามารถ monitor อุปกรณ์หลายพัน devices พร้อม alerting, visualization และ automation
Zabbix เป็นทางเลือกที่ดี สำหรับองค์กรที่ต้องการ monitoring solution ฟรี ที่มีฟีเจอร์เทียบเท่า commercial products เช่น SolarWinds, PRTG หรือ Datadog มี community ขนาดใหญ่ templates มากมาย และ Zabbix Inc. ให้บริการ commercial support สำหรับองค์กรที่ต้องการ บทความนี้จะสอนวิธีติดตั้ง config และใช้งาน Zabbix สำหรับ network monitoring
Zabbix Architecture
| Component | บทบาท |
|---|---|
| Zabbix Server | Core component: รวบรวม data, ประมวลผล triggers, ส่ง alerts |
| Zabbix Frontend (Web UI) | Web interface สำหรับ configuration, dashboards, reports |
| Database | เก็บ configuration + historical data (MySQL/PostgreSQL) |
| Zabbix Agent | ติดตั้งบน host ที่ต้องการ monitor (Linux/Windows) |
| Zabbix Proxy | Distributed monitoring: รวบรวม data จาก remote sites |
| SNMP | Monitor network devices (switches, routers, firewalls) |
Installation (Ubuntu/Debian)
Quick Install
Step 1: Add Zabbix Repository: wget https://repo.zabbix.com/zabbix/7.0/ubuntu/pool/main/z/zabbix-release/zabbix-release_latest_7.0+ubuntu22.04_all.deb dpkg -i zabbix-release_latest_7.0+ubuntu22.04_all.deb apt update
Step 2: Install Zabbix Server + Frontend: apt install zabbix-server-mysql zabbix-frontend-php zabbix-apache-conf zabbix-sql-scripts zabbix-agent2
Step 3: Create Database: mysql -u root -p CREATE DATABASE zabbix CHARACTER SET utf8mb4 COLLATE utf8mb4_bin; CREATE USER ‘zabbix’@’localhost’ IDENTIFIED BY ‘password’; GRANT ALL ON zabbix.* TO ‘zabbix’@’localhost’; Import schema: zcat /usr/share/zabbix-sql-scripts/mysql/server.sql.gz | mysql -uzabbix -p zabbix
Step 4: Configure + Start: แก้ /etc/zabbix/zabbix_server.conf: DBPassword=password systemctl restart zabbix-server zabbix-agent2 apache2 systemctl enable zabbix-server zabbix-agent2 apache2 เข้า http://server-ip/zabbix เพื่อ setup wizard
Monitoring Network Devices (SNMP)
Config SNMP บน Switch/Router
Cisco IOS: snmp-server community public RO snmp-server location “Server Room” snmp-server contact “[email protected]” snmp-server enable traps
Zabbix: Configuration → Hosts → Create Host กรอก Host name, IP address เลือก Group: Network devices เพิ่ม SNMP interface: IP, SNMP version (v2c/v3), community Link Templates: เช่น “Cisco IOS SNMP” หรือ “Template Net Interfaces SNMP”
Zabbix Templates
| Template | Monitor อะไร |
|---|---|
| Linux by Zabbix agent | CPU, Memory, Disk, Network, Processes |
| Windows by Zabbix agent | CPU, Memory, Disk, Services, Event Log |
| Cisco IOS SNMP | Interfaces, CPU, Memory, Inventory |
| Template Net Interfaces SNMP | Interface traffic, errors, status |
| ICMP Ping | Availability (ping), latency, packet loss |
| HTTP/HTTPS Website | Web availability, response time, SSL cert |
| VMware | ESXi hosts, VMs, datastores |
Triggers และ Alerts
ตั้งเงื่อนไข Alert
| Trigger Example | Condition | Severity |
|---|---|---|
| Host is down | ICMP ping fail > 3 ครั้ง | High |
| High CPU | CPU > 90% นาน > 5 นาที | Warning |
| Disk almost full | Disk usage > 90% | High |
| Interface down | Interface operational status = down | Average |
| High interface utilization | Bandwidth > 80% ของ capacity | Warning |
| High packet loss | ICMP loss > 5% | Average |
Alert Channels
| Channel | Setup |
|---|---|
| Built-in SMTP configuration | |
| LINE Notify | Webhook integration |
| Telegram | Built-in media type |
| Slack | Webhook integration |
| PagerDuty | Built-in integration |
| SMS | External script / API |
Dashboards
สร้าง NOC Dashboard
Recommended Widgets: Map: แสดง network topology + status (green/red) Problems: แสดง active problems เรียงตาม severity Graph: bandwidth utilization ของ WAN links Top Hosts: hosts ที่ใช้ CPU/Memory สูงสุด Clock + System Info: เวลา + Zabbix server status
Best Practices
| Practice | รายละเอียด |
|---|---|
| ใช้ Templates | อย่าสร้าง items/triggers เอง ใช้ templates ที่มีอยู่ |
| ใช้ SNMP v3 | v2c ส่ง community string เป็น plain text ไม่ปลอดภัย |
| ตั้ง Housekeeping | กำหนดระยะเวลาเก็บ data (เช่น 90 วัน) ป้องกัน DB โต |
| ใช้ Proxy สำหรับ remote sites | ลด traffic ระหว่าง sites + redundancy |
| ตั้ง Maintenance windows | ป้องกัน false alerts ระหว่าง planned maintenance |
| Monitor Zabbix server ด้วย | ตรวจสอบ Zabbix server health (queue, cache, DB) |
Zabbix vs Competitors
| Feature | Zabbix | PRTG | Nagios | Prometheus+Grafana |
|---|---|---|---|---|
| ราคา | ฟรี (open-source) | $1,750+ (100 sensors free) | ฟรี (Core) / $2,000+ (XI) | ฟรี (open-source) |
| Web UI | ดี (built-in) | ดีมาก | พื้นฐาน | ดีมาก (Grafana) |
| SNMP Support | ดีมาก | ดีมาก | ดี (plugins) | ต้อง exporter |
| Scalability | สูง (100,000+ devices) | ปานกลาง | สูง | สูงมาก |
| Learning Curve | ปานกลาง | ต่ำ | สูง | สูง |
ทิ้งท้าย: Zabbix เป็น Enterprise Monitoring ที่ดีที่สุดในกลุ่ม Open Source
Zabbix ให้ฟีเจอร์ครบถ้วนสำหรับ network monitoring โดยไม่เสียค่า license ติดตั้งง่าย มี templates สำเร็จรูป รองรับ SNMP, agents, IPMI ครบ Alerting ผ่าน Email, LINE, Telegram, Slack Dashboard สำหรับ NOC
อ่านเพิ่มเติมเกี่ยวกับ SNMP v3 และ Network Troubleshooting ที่ siamlancard.com หรือจาก icafeforex.com และ siam2r.com


