
Wireshark Tutorial: วิธีใช้ Wireshark วิเคราะห์ Packets เบื้องต้น
Wireshark เป็น network protocol analyzer (packet sniffer) ที่นิยมที่สุดในโลก ใช้สำหรับ capture และวิเคราะห์ packets ที่วิ่งอยู่ใน network เป็นเครื่องมือที่ network engineer, security analyst และ developer ต้องรู้จัก ฟรี open-source ใช้ได้บน Windows, macOS และ Linux
Wireshark ช่วยในหลายสถานการณ์: troubleshooting (หาสาเหตุที่ application ช้า), security analysis (ตรวจจับ malware traffic), protocol learning (เรียนรู้ว่า protocol ทำงานอย่างไรจริงๆ), compliance (ตรวจสอบว่า traffic encrypted) บทความนี้จะสอนใช้ Wireshark ตั้งแต่เริ่มต้น
ติดตั้งและเริ่มต้น
Installation
ดาวน์โหลด Wireshark จาก wireshark.org ติดตั้งพร้อม Npcap (Windows) หรือ libpcap (Linux) สำหรับ capture packets เปิด Wireshark เลือก interface ที่ต้องการ capture (Ethernet, WiFi) กด Start Capture (ปุ่มครีบฉลามสีน้ำเงิน)
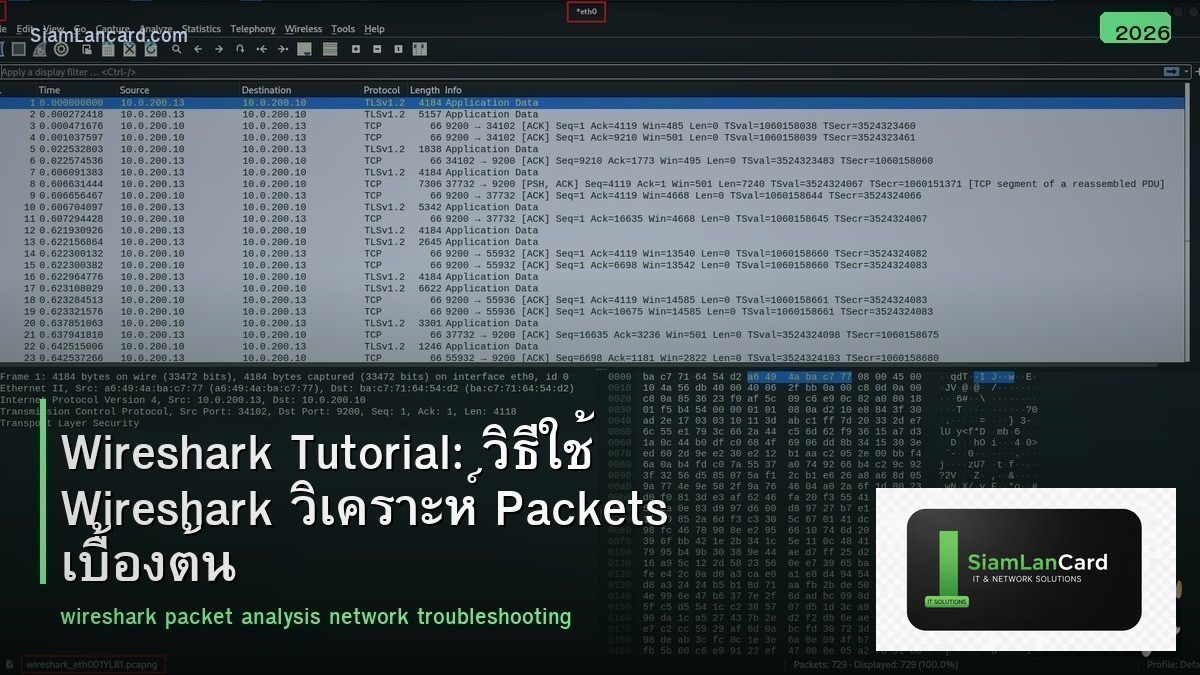
Interface หลัก
| ส่วน | หน้าที่ |
|---|---|
| Packet List (บน) | แสดง packets ทั้งหมดที่ capture ได้ (1 บรรทัด = 1 packet) |
| Packet Details (กลาง) | แสดงรายละเอียดของ packet ที่เลือก (แยกตาม layer/protocol) |
| Packet Bytes (ล่าง) | แสดง raw bytes (hex + ASCII) ของ packet |
| Display Filter Bar | กรอง packets ที่แสดง (ไม่กระทบ capture) |
Display Filters ที่ใช้บ่อย
Basic Filters
| Filter | แสดง |
|---|---|
| ip.addr == 10.0.1.100 | Packets ที่มี IP 10.0.1.100 (src หรือ dst) |
| ip.src == 10.0.1.100 | Packets จาก IP 10.0.1.100 |
| ip.dst == 10.0.1.100 | Packets ไปยัง IP 10.0.1.100 |
| tcp.port == 443 | TCP packets ที่ port 443 (HTTPS) |
| udp.port == 53 | UDP packets ที่ port 53 (DNS) |
| http | HTTP traffic ทั้งหมด |
| dns | DNS queries และ responses |
| tcp.flags.syn == 1 | TCP SYN packets (connection initiation) |
| tcp.flags.rst == 1 | TCP RST packets (connection reset) |
| tcp.analysis.retransmission | TCP retransmissions (บ่งบอก packet loss) |
Combined Filters
ใช้ and, or, not รวม filters: ip.addr == 10.0.1.100 and tcp.port == 80 (HTTP traffic จาก/ไป 10.0.1.100) dns and ip.src == 10.0.1.100 (DNS queries จาก 10.0.1.100) not arp and not icmp (ซ่อน ARP และ ICMP) tcp.port == 443 and tcp.analysis.retransmission (HTTPS retransmissions)
การวิเคราะห์ TCP Connection
TCP 3-Way Handshake
SYN → SYN-ACK → ACK ทุก TCP connection เริ่มด้วย 3-way handshake filter: tcp.flags.syn == 1 เห็น SYN packets ทั้งหมด ถ้าเห็น SYN แต่ไม่มี SYN-ACK = server ไม่ตอบ (down, firewall block, wrong port) ถ้าเห็น SYN, SYN-ACK แต่ไม่มี ACK = client ไม่ตอบ (อาจเป็น SYN scan)
TCP Retransmissions
Retransmissions บ่งบอกว่ามี packet loss ใน network filter: tcp.analysis.retransmission ถ้ามี retransmissions มาก = network มีปัญหา (congestion, faulty cable, bad interface) ดู % retransmission: Statistics → Conversations → TCP → % retransmission < 1% = ปกติ, 1-5% = มีปัญหาบ้าง, > 5% = ปัญหาร้ายแรง
การวิเคราะห์ DNS
DNS Troubleshooting
filter: dns เห็น DNS queries (questions) และ responses (answers) ดู: Response time (dns.time) ถ้า > 100ms = DNS server ช้า Response code: No error (0) = ปกติ, NXDOMAIN (3) = domain ไม่มี, SERVFAIL (2) = DNS server error ถ้า user บอกเข้า website ไม่ได้ ดู DNS ก่อนว่า resolve ได้หรือไม่
การวิเคราะห์ HTTP
HTTP Troubleshooting
filter: http (สำหรับ HTTP plaintext) สำหรับ HTTPS (encrypted) จะเห็นเฉพาะ TCP + TLS ไม่เห็น HTTP content ดู HTTP response codes: 200 = OK, 301/302 = redirect, 404 = not found, 500 = server error ดู response time: เวลาระหว่าง HTTP request กับ response ถ้า server response ช้า = server-side issue ถ้า network latency สูง = network issue
Statistics ที่มีประโยชน์
| Menu | ข้อมูล | ใช้ทำอะไร |
|---|---|---|
| Statistics → Conversations | Top talkers (IP pairs + bytes) | หาว่าใครใช้ bandwidth มากสุด |
| Statistics → Protocol Hierarchy | % traffic แยกตาม protocol | เห็นภาพรวม traffic composition |
| Statistics → I/O Graphs | Throughput over time | เห็น traffic pattern, spikes |
| Statistics → Endpoints | Top endpoints (IP + bytes) | หา top talkers |
| Analyze → Expert Information | Warnings, errors ที่ Wireshark detect | หาปัญหาอัตโนมัติ |
Capture Filters vs Display Filters
| ประเภท | เมื่อทำงาน | Syntax | ตัวอย่าง |
|---|---|---|---|
| Capture Filter | ตอน capture (กรองก่อนเก็บ) | BPF syntax | host 10.0.1.100, port 80 |
| Display Filter | หลัง capture (กรองตอนแสดง) | Wireshark syntax | ip.addr == 10.0.1.100, tcp.port == 80 |
แนะนำ: ใช้ capture filter เมื่อ traffic volume สูงมาก (ลดขนาด capture file) ใช้ display filter เมื่อต้องการ flexibility ในการวิเคราะห์
Tips สำหรับ Beginners
เริ่มจาก Follow TCP Stream
Right-click packet → Follow → TCP Stream แสดง conversation ทั้งหมดระหว่าง 2 endpoints เป็นข้อความ (ไม่ต้องอ่าน packet ทีละตัว) เหมาะสำหรับดู HTTP requests/responses, SMTP emails, FTP commands
ใช้ Coloring Rules
Wireshark มี coloring rules เพื่อให้เห็นปัญหาง่ายขึ้น สีแดง/ดำ = errors (RST, retransmission) สีเขียวอ่อน = HTTP สีน้ำเงินอ่อน = DNS สีเหลือง = TCP warnings ปรับ coloring rules ได้ที่ View → Coloring Rules
ทิ้งท้าย: Wireshark เป็น Must-Have Tool
Wireshark เป็นเครื่องมือที่ทุก network professional ต้องรู้จัก ไม่ต้องเป็น expert ทันที เริ่มจาก capture traffic ของตัวเอง ใช้ display filters หาสิ่งที่สนใจ ดู TCP handshake, DNS queries, HTTP traffic ฝึกทุกวัน จะเข้าใจ network ดีขึ้นเรื่อยๆ
อ่านเพิ่มเติมเกี่ยวกับ Network Troubleshooting และ Network TAP และ SPAN ที่ siamlancard.com หรือจาก icafeforex.com และ siam2r.com


