
Network Traffic Analysis ด้วย Wireshark: จับ Packets วิเคราะห์ปัญหา
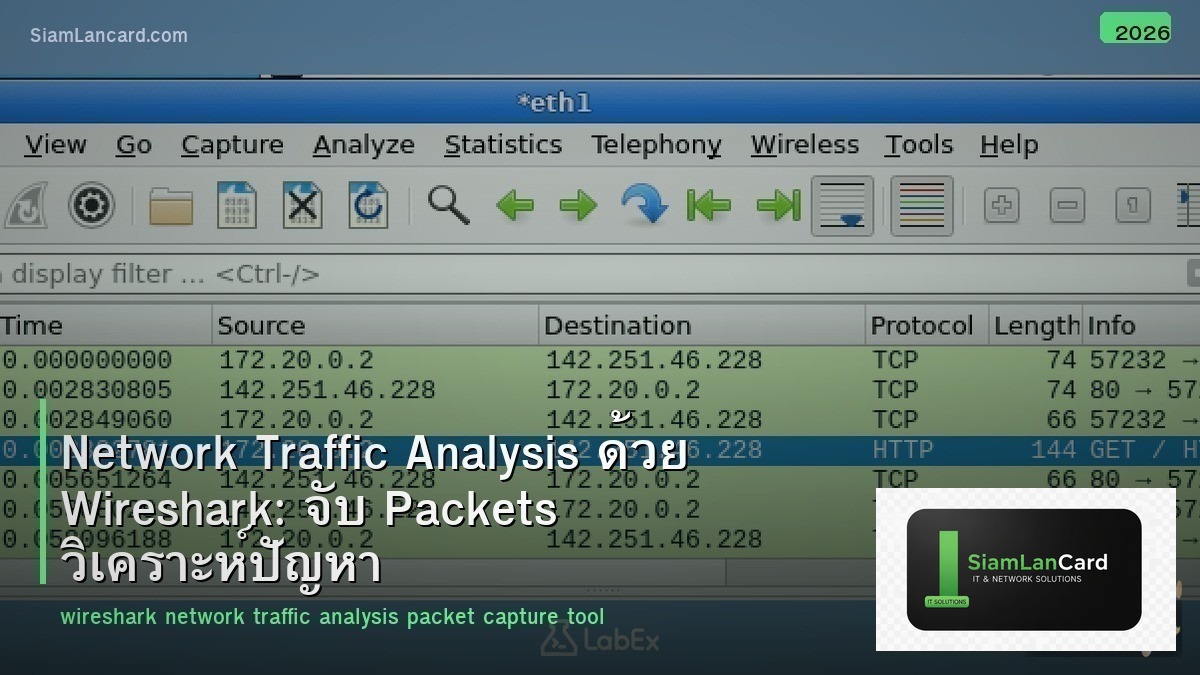
Wireshark เป็น open-source network protocol analyzer ที่ใช้กันมากที่สุดในโลก สามารถ capture packets จาก network interface แล้ว decode ทุก protocol layer ให้ดูได้ เป็นเครื่องมือที่ขาดไม่ได้สำหรับ network troubleshooting, security analysis และ application debugging
Wireshark ให้ข้อมูล ระดับ packet ที่เครื่องมืออื่นไม่สามารถให้ได้ เมื่อ ping, traceroute และ show commands ไม่เพียงพอ Wireshark จะบอกว่าเกิดอะไรขึ้นจริงๆ บน wire เช่น TCP retransmissions, DNS failures, TLS handshake errors, slow server response บทความนี้จะสอนวิธีใช้ Wireshark วิเคราะห์ปัญหา network
Wireshark Basics
การ Capture
เลือก Interface: เลือก network interface ที่ต้องการ capture (Ethernet, WiFi, Loopback) Capture Filter: กรอง traffic ก่อน capture (ลด file size) เช่น: host 10.0.1.100 (เฉพาะ IP นี้) port 443 (เฉพาะ HTTPS) net 192.168.1.0/24 (เฉพาะ subnet นี้) Start Capture: กด Start → Wireshark จับ packets real-time Stop + Save: กด Stop → Save เป็น .pcap/.pcapng
Display Filters
กรอง Packets หลัง Capture
| Filter | ใช้ทำอะไร |
|---|---|
| ip.addr == 10.0.1.100 | แสดง packets จาก/ไป IP นี้ |
| tcp.port == 443 | แสดงเฉพาะ HTTPS traffic |
| dns | แสดงเฉพาะ DNS queries/responses |
| http.request | แสดงเฉพาะ HTTP requests |
| tcp.analysis.retransmission | แสดงเฉพาะ TCP retransmissions |
| tcp.flags.syn == 1 && tcp.flags.ack == 0 | แสดงเฉพาะ TCP SYN (new connections) |
| frame.time_delta > 1 | แสดง packets ที่มี delay > 1 วินาที |
| !(arp || dns || icmp) | ซ่อน ARP, DNS, ICMP (ลด noise) |
วิเคราะห์ปัญหาที่พบบ่อย
1. TCP Retransmissions (Network ช้า)
Filter: tcp.analysis.retransmission สาเหตุ: Packet loss (congestion, bad cable, wireless interference) Server ตอบช้า (overloaded) Firewall drop packets วิธีดู: ดูจำนวน retransmissions เทียบกับ total packets retransmission rate > 2% = มีปัญหา ดู Expert Info (Analyze → Expert Information) สำหรับ summary
2. DNS Failures (เข้าเว็บไม่ได้)
Filter: dns ตรวจ: DNS query ถูกส่งออกไปหรือไม่ มี DNS response กลับมาหรือไม่ Response code: NOERROR (OK), NXDOMAIN (domain ไม่มี), SERVFAIL (server error) Response time: > 500ms = DNS server ช้า
3. TCP Connection Issues
Filter: tcp.flags.syn == 1 ตรวจ: มี SYN → SYN-ACK → ACK (3-way handshake) สมบูรณ์หรือไม่ ถ้ามี SYN แต่ไม่มี SYN-ACK = server ไม่ตอบ (down, firewall block) ถ้ามี RST = connection refused (port ไม่เปิด) SYN retransmissions = server ไม่ reachable
4. Slow Application Response
วิธีวัด: ดู time delta ระหว่าง request → response ตัวอย่าง HTTP: time ระหว่าง HTTP GET → HTTP 200 OK TCP handshake time: SYN → SYN-ACK (network latency) Server think time: SYN-ACK → first data packet
Wireshark Statistics
| Menu | ข้อมูล |
|---|---|
| Statistics → Conversations | Top talkers (IP pairs ที่มี traffic มากสุด) |
| Statistics → Protocol Hierarchy | สัดส่วน protocols (HTTP, DNS, TLS, etc.) |
| Statistics → IO Graphs | Traffic over time (หา spikes) |
| Statistics → Endpoints | ทุก IP/MAC ที่เห็นใน capture |
| Statistics → DNS | DNS query statistics |
| Analyze → Expert Information | Warnings, errors, notes (สรุปปัญหา) |
| Statistics → TCP Stream Graphs | TCP throughput, round-trip time, window scaling |
Capture บน Remote Devices
| วิธี | ใช้กับ | Command |
|---|---|---|
| SPAN/Mirror Port | Switch | monitor session 1 source int Gi0/1 dest int Gi0/48 |
| tcpdump + SSH | Linux server | ssh user@server tcpdump -w – | wireshark -k -i – |
| EPC (Embedded Packet Capture) | Cisco IOS | monitor capture buffer → export |
| TAP (Network TAP) | Physical link | Passive device ดัก traffic บน cable |
Best Practices
| Practice | ทำไม |
|---|---|
| ใช้ capture filter ลด file size | Capture ทุกอย่างอาจได้ file หลาย GB |
| Capture ทั้ง 2 ฝั่ง (client + server) | เปรียบเทียบว่า packets หายตรงไหน |
| จับเวลาให้สั้น แล้ว reproduce ปัญหา | ง่ายต่อการวิเคราะห์ |
| ใช้ Expert Information ก่อน | Wireshark สรุปปัญหาให้อัตโนมัติ |
| Save capture file สำหรับ analysis ภายหลัง | อาจต้อง review อีกครั้ง |
ทิ้งท้าย: Wireshark เป็นเครื่องมือที่ Network Engineer ต้องเชี่ยวชาญ
Wireshark ให้ข้อมูลระดับ packet ที่ tools อื่นไม่มี เริ่มจาก display filters พื้นฐาน ดู Expert Information สำหรับ quick analysis ฝึกวิเคราะห์ TCP 3-way handshake, DNS, HTTP เป็นประจำ ใช้ Statistics menu สำหรับ high-level overview
อ่านเพิ่มเติมเกี่ยวกับ Network Troubleshooting Methodology และ SNMP v3 Monitoring ที่ siamlancard.com หรือจาก icafeforex.com และ siam2r.com


