Home » Network Traffic Analysis: Wireshark, tcpdump และ Packet Capture
Network Traffic Analysis: Wireshark, tcpdump และ Packet Capture
Network Traffic Analysis: Wireshark, tcpdump และ Packet Capture
Network Traffic Analysis คือการจับและวิเคราะห์ packets ที่วิ่งผ่าน network เพื่อ troubleshoot ปัญหา, ตรวจจับ security threats และ optimize performance Wireshark เป็น GUI-based analyzer ที่ทรงพลังที่สุด tcpdump เป็น command-line tool ที่เบาและเร็ว ทั้งสองเป็น essential tools สำหรับ network engineers
Network issues หลายอย่าง ไม่สามารถ debug ได้จาก logs หรือ SNMP เพียงอย่างเดียว ต้องดู actual packets จึงจะเห็นว่าเกิดอะไรขึ้นจริง เช่น TCP retransmissions, DNS failures, TLS handshake errors หรือ malicious traffic Packet capture เป็น ground truth ของ network communication
Packet Capture Methods
| Method |
วิธีทำ |
เหมาะกับ |
| SPAN/Mirror Port |
Switch copy traffic จาก source port ไป monitor port |
Switch-level capture |
| Network TAP |
Hardware device ที่ copy traffic แบบ passive (inline) |
Production traffic, no packet drops |
| Host-based |
Capture บน server/endpoint โดยตรง (tcpdump, Wireshark) |
Application-level troubleshooting |
| Inline Device |
Firewall, IDS/IPS capture traffic ที่ผ่าน |
Security analysis |
| Cloud VPC Flow Logs |
AWS/Azure/GCP flow logs (metadata, ไม่ใช่ full packet) |
Cloud traffic analysis |
tcpdump
| Command |
ผลลัพธ์ |
| tcpdump -i eth0 |
Capture ทุก packet บน eth0 |
| tcpdump -i eth0 -c 100 |
Capture 100 packets แล้วหยุด |
| tcpdump -i eth0 -w capture.pcap |
Save เป็น pcap file (เปิดใน Wireshark) |
| tcpdump -i eth0 host 192.168.1.1 |
Filter เฉพาะ traffic ไป/จาก host นี้ |
| tcpdump -i eth0 port 80 |
Filter เฉพาะ port 80 (HTTP) |
| tcpdump -i eth0 tcp and port 443 |
Filter TCP port 443 (HTTPS) |
| tcpdump -i eth0 src 10.0.0.1 and dst port 53 |
Filter DNS queries จาก specific source |
| tcpdump -i eth0 -nn -v |
No name resolution + verbose output |
| tcpdump -r capture.pcap |
Read จาก pcap file |
tcpdump BPF Filters
| Filter |
ความหมาย |
| host 10.0.0.1 |
Traffic ไป/จาก host |
| src host 10.0.0.1 |
Traffic จาก source เท่านั้น |
| dst host 10.0.0.1 |
Traffic ไป destination เท่านั้น |
| net 10.0.0.0/24 |
Traffic ใน subnet |
| port 80 |
TCP/UDP port 80 |
| tcp |
TCP traffic เท่านั้น |
| udp |
UDP traffic เท่านั้น |
| icmp |
ICMP traffic (ping) |
| not port 22 |
Exclude SSH traffic |
| tcp[tcpflags] & (tcp-syn) != 0 |
TCP SYN packets เท่านั้น |
Wireshark
| Feature |
รายละเอียด |
| GUI |
Packet list + packet details + packet bytes (3-pane view) |
| Display Filters |
Filter packets หลัง capture (ต่างจาก capture filters) |
| Protocol Dissectors |
Decode 3000+ protocols (HTTP, DNS, TLS, BGP, OSPF, etc.) |
| Follow Stream |
Right-click → Follow → TCP/UDP/HTTP stream (ดู conversation) |
| Statistics |
Conversations, endpoints, protocol hierarchy, I/O graphs |
| Expert Info |
Automatic warnings (retransmissions, resets, errors) |
| Coloring Rules |
Color-code packets ตาม type (errors=red, TCP=green, etc.) |
Wireshark Display Filters
| Filter |
ผลลัพธ์ |
| ip.addr == 10.0.0.1 |
Traffic ไป/จาก IP |
| tcp.port == 443 |
TCP port 443 |
| http.request.method == “GET” |
HTTP GET requests |
| dns.qry.name contains “example” |
DNS queries ที่มี “example” |
| tcp.analysis.retransmission |
TCP retransmissions (performance issue) |
| tcp.flags.reset == 1 |
TCP RST packets (connection refused/reset) |
| tls.handshake.type == 1 |
TLS Client Hello |
| frame.time_delta > 1 |
Packets ที่ห่างกัน > 1 second (latency) |
| !(arp or dns or icmp) |
Exclude ARP, DNS, ICMP |
Common Troubleshooting Patterns
| Issue |
What to Look For |
Wireshark Filter |
| Slow connection |
TCP retransmissions, high RTT, window size issues |
tcp.analysis.retransmission |
| Connection refused |
TCP RST after SYN |
tcp.flags.reset == 1 |
| DNS failure |
NXDOMAIN, SERVFAIL, no response |
dns.flags.rcode != 0 |
| TLS errors |
Handshake failure, certificate issues |
tls.alert_message |
| Packet loss |
TCP retransmissions, duplicate ACKs |
tcp.analysis.duplicate_ack |
| MTU issues |
ICMP “Fragmentation Needed” (DF bit set) |
icmp.type == 3 and icmp.code == 4 |
| ARP issues |
ARP requests without replies, gratuitous ARP |
arp |
TCP Analysis
| TCP Event |
ความหมาย |
Concern Level |
| SYN → SYN-ACK → ACK |
Normal 3-way handshake |
Normal |
| Retransmission |
Packet ส่งซ้ำ (original lost) |
Warning (packet loss) |
| Duplicate ACK |
Receiver ส่ง ACK ซ้ำ (missing segment) |
Warning |
| Fast Retransmission |
Retransmit หลัง 3 duplicate ACKs |
Warning (selective loss) |
| Zero Window |
Receiver buffer full (stop sending) |
Warning (receiver slow) |
| RST |
Connection reset (refused or aborted) |
Error |
| FIN → ACK → FIN → ACK |
Normal connection close (4-way) |
Normal |
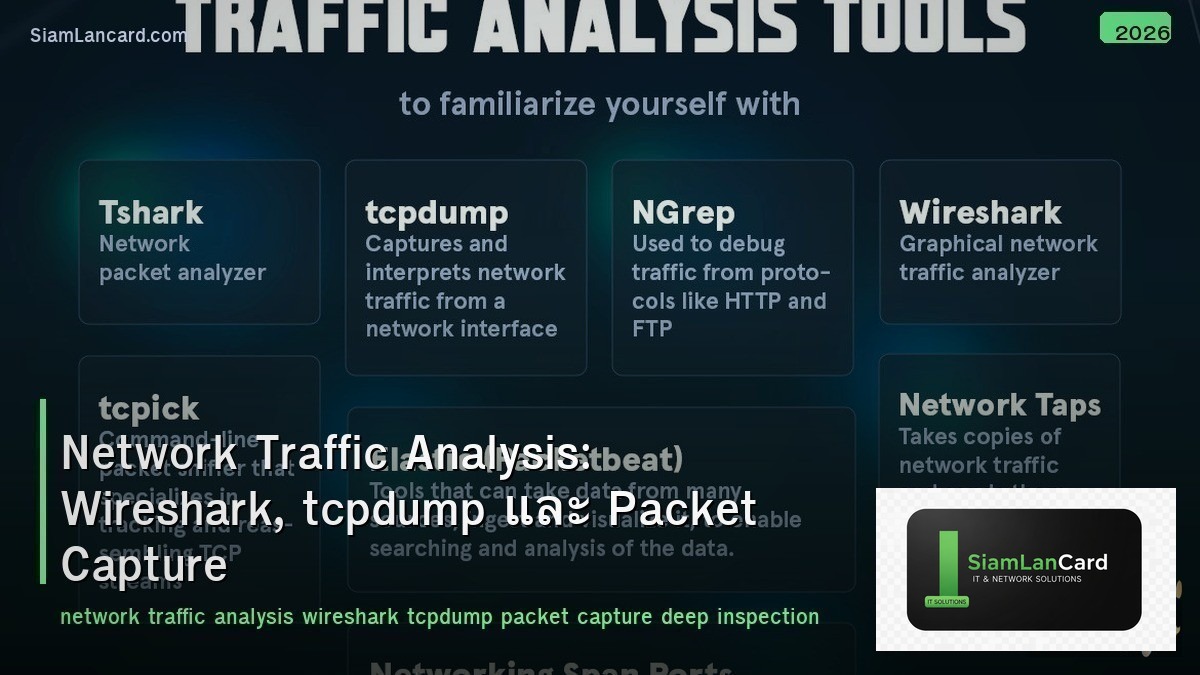
Other Tools
| Tool |
Type |
จุดเด่น |
| tshark |
CLI (Wireshark’s CLI) |
Wireshark dissectors ใน command line |
| ngrep |
CLI |
grep for network traffic (pattern matching) |
| Zeek (Bro) |
Network Security Monitor |
Generate logs จาก pcap (conn, dns, http, ssl logs) |
| NetworkMiner |
GUI |
Extract files, images, credentials จาก pcap |
| Moloch/Arkime |
Full packet capture + search |
Large-scale indexed packet capture |
ทิ้งท้าย: Packet Capture = Network Ground Truth
Traffic Analysis tcpdump = lightweight CLI capture, Wireshark = powerful GUI analysis SPAN/TAP สำหรับ capture traffic จาก switch BPF filters (tcpdump) สำหรับ capture-time filtering Display filters (Wireshark) สำหรับ post-capture analysis TCP retransmissions, RST, zero window = common performance indicators Follow TCP Stream สำหรับดู full conversation
อ่านเพิ่มเติมเกี่ยวกับ Network Troubleshooting Methodology และ TCP IP Deep Dive ที่ siamlancard.com หรือจาก icafeforex.com และ siam2r.com


