Home » Network Performance Monitoring: วัดและปรับปรุงประสิทธิภาพ Network
Network Performance Monitoring: วัดและปรับปรุงประสิทธิภาพ Network
Network Performance Monitoring: วัดและปรับปรุงประสิทธิภาพ Network
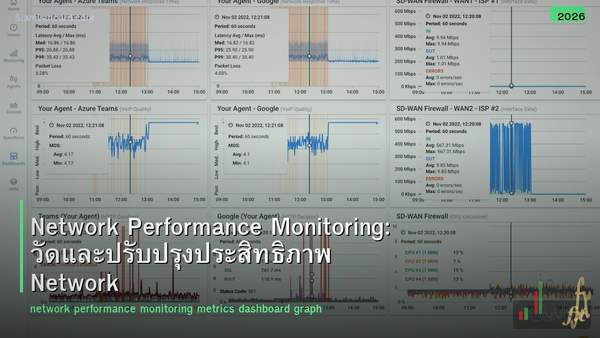
Network Performance Monitoring (NPM) คือกระบวนการวัด วิเคราะห์ และปรับปรุงประสิทธิภาพของ network อย่างต่อเนื่อง เพื่อให้มั่นใจว่า applications และ services ทำงานได้ตาม SLA ที่กำหนด NPM ช่วยตรวจจับปัญหาก่อนที่ users จะรู้สึก ลดเวลา downtime และวางแผน capacity ได้อย่างมีข้อมูล
หลายองค์กร รู้ว่า network มีปัญหาเมื่อ users โทรมาแจ้ง ซึ่งหมายความว่าปัญหาเกิดขึ้นแล้วและกระทบ productivity แล้ว NPM ที่ดีช่วยตรวจจับ anomalies ตั้งแต่เริ่ม (proactive) ไม่ใช่รอให้เกิดแล้วค่อยแก้ (reactive) บทความนี้จะอธิบาย metrics สำคัญ เครื่องมือ และ best practices สำหรับ NPM
Key Metrics
| Metric |
วัดอะไร |
ค่าที่ดี |
ค่าที่เป็นปัญหา |
| Bandwidth Utilization |
% ของ bandwidth ที่ใช้ |
< 70% |
> 80% (congestion risk) |
| Latency |
เวลาที่ packet เดินทาง (ms) |
< 50ms (LAN < 1ms) |
> 100ms (ช้า) |
| Jitter |
ความแปรปรวนของ latency (ms) |
< 30ms |
> 50ms (VoIP/video เสีย) |
| Packet Loss |
% ของ packets ที่หาย |
< 0.1% |
> 1% (กระทบ performance) |
| Throughput |
Data จริงที่ส่งได้ (Mbps) |
ใกล้เคียง link speed |
ต่ำกว่า 50% ของ link speed |
| Availability |
% uptime ของ device/link |
> 99.9% |
< 99% (> 3.6 วัน downtime/ปี) |
| Error Rate |
CRC, frame, input/output errors |
0 |
เพิ่มขึ้นต่อเนื่อง |
| CPU/Memory |
Device resource utilization |
< 60% |
> 80% |
Monitoring Protocols
| Protocol |
วิธีการ |
ข้อมูลที่ได้ |
| SNMP (v2c/v3) |
Poll device ทุก interval (เช่น 5 นาที) |
Interface stats, CPU, memory, uptime |
| NetFlow/sFlow/IPFIX |
Export flow data จาก router/switch |
Traffic flows, top talkers, protocols |
| ICMP (Ping) |
Send echo requests |
Latency, packet loss, availability |
| Syslog |
Receive log messages จาก devices |
Events, errors, config changes |
| SNMP Traps |
Device ส่ง notification เมื่อเกิด event |
Link down, high CPU, threshold alerts |
| Streaming Telemetry |
Push-based real-time data (gRPC/gNMI) |
Real-time metrics (แทน SNMP polling) |
NPM Tools
| Tool |
ประเภท |
จุดเด่น |
ราคา |
| PRTG Network Monitor |
Commercial |
ใช้ง่าย sensors-based 100 sensors free |
Free (100) / $1,750+ |
| Zabbix |
Open-source |
Powerful free enterprise-grade |
Free |
| Nagios / Nagios XI |
Open-source / Commercial |
Plugin ecosystem ใหญ่ |
Free / $2,000+ |
| SolarWinds NPM |
Commercial |
Feature-rich enterprise standard |
$2,955+ |
| LibreNMS |
Open-source |
Auto-discovery SNMP-based free |
Free |
| Datadog |
Cloud SaaS |
Cloud-native APM + NPM |
$15+/host/mo |
| Grafana + Prometheus |
Open-source |
Beautiful dashboards flexible |
Free |
| ThousandEyes (Cisco) |
Cloud SaaS |
Internet path visibility end-to-end |
$$$ |
Dashboard Design
สิ่งที่ต้องมีบน Dashboard
| Dashboard |
แสดงอะไร |
ใครดู |
| Overview |
Overall health สีเขียว/เหลือง/แดง ทุก site |
Management NOC |
| Network Map |
Topology + link status + utilization |
NOC Engineers |
| Top Talkers |
Devices/Users ที่ใช้ bandwidth มากสุด |
Engineers |
| WAN Links |
Utilization latency packet loss ทุก WAN link |
NOC Engineers |
| Device Health |
CPU memory uptime errors ทุก device |
Engineers |
| SLA Compliance |
Availability % latency % against SLA targets |
Management |
Alerting Best Practices
| Practice |
รายละเอียด |
| ตั้ง threshold ที่เหมาะสม |
Warning 70% Critical 85% (ไม่ตั้งแคบเกินไป) |
| ใช้ escalation |
Alert → Email, Critical → SMS/PagerDuty |
| หลีกเลี่ยง alert fatigue |
อย่ามี alerts เยอะเกินไป focus ที่สำคัญจริงๆ |
| Correlate alerts |
รวม related alerts เป็น incident เดียว |
| ทดสอบ alerts |
ตรวจสอบว่า alerts ทำงานจริง (fire drill) |
Capacity Planning
| Step |
Action |
| 1. Baseline |
วัด current utilization ทุก link/device (30-90 วัน) |
| 2. Trend Analysis |
ดู growth rate ของ bandwidth usage |
| 3. Forecast |
คาดการณ์ว่าจะถึง capacity เมื่อไหร่ |
| 4. Plan Upgrades |
วางแผน upgrade ก่อนถึง 80% utilization |
| 5. Review |
ทบทวนทุก quarter |
Streaming Telemetry vs SNMP
| คุณสมบัติ |
SNMP Polling |
Streaming Telemetry |
| Model |
Pull (poll ทุก 5 นาที) |
Push (device ส่ง real-time) |
| Resolution |
5 นาที (typical) |
วินาที (near real-time) |
| Scalability |
จำกัด (polling overhead) |
ดีกว่า (push-based) |
| Data Format |
MIB/OID (complex) |
YANG models (structured) |
| Transport |
UDP port 161 |
gRPC/gNMI (TCP) |
| Support |
ทุก device |
Modern devices (IOS-XE, NX-OS, Junos) |
ทิ้งท้าย: Monitor ก่อน มีปัญหาทีหลัง
NPM เปลี่ยนจาก reactive เป็น proactive วัด 5 metrics หลัก: bandwidth, latency, jitter, packet loss, availability ใช้ SNMP + NetFlow + Ping เป็นพื้นฐาน ตั้ง alerts ที่เหมาะสม ไม่มากไม่น้อย ใช้ข้อมูลสำหรับ capacity planning
อ่านเพิ่มเติมเกี่ยวกับ NetFlow sFlow Traffic Analysis และ Network Troubleshooting Tools ที่ siamlancard.com หรือจาก icafeforex.com และ siam2r.com


