Home » Network Packet Analysis: Wireshark, tcpdump, Packet Capture และ Protocol Decode
Network Packet Analysis: Wireshark, tcpdump, Packet Capture และ Protocol Decode
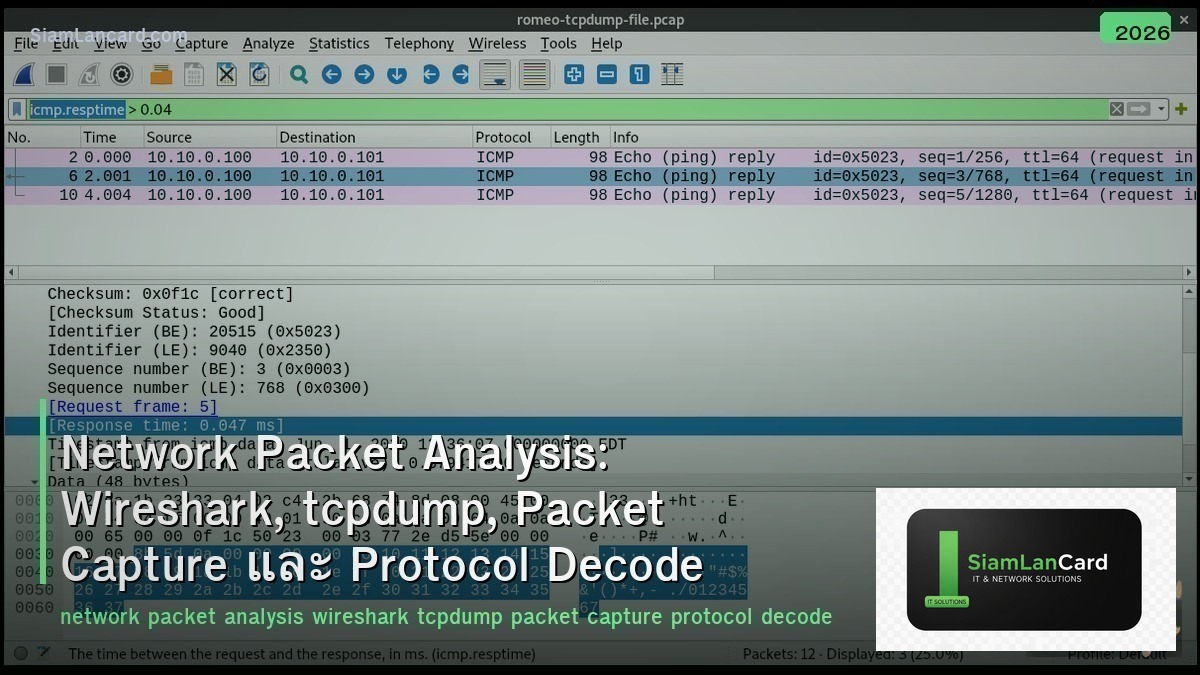
Network Packet Analysis: Wireshark, tcpdump, Packet Capture และ Protocol Decode
Network Packet Analysis เป็นทักษะสำคัญสำหรับ network engineers ในการ troubleshoot และ analyze network traffic Wireshark เป็น GUI-based packet analyzer ที่ทรงพลังที่สุด, tcpdump เป็น CLI tool สำหรับ capture บน servers/routers, Packet Capture techniques ครอบคลุมวิธีดักจับ traffic จากจุดต่างๆ ใน network และ Protocol Decode อ่านและตีความ packet headers เพื่อเข้าใจ network behavior
เมื่อมีปัญหา network ที่ซับซ้อน packet capture คือ “ground truth” ที่บอกว่าเกิดอะไรขึ้นจริงๆ บน wire ไม่ต้องเดา ไม่ต้องพึ่งแค่ logs หรือ SNMP counters Packet analysis เห็น TCP retransmissions, DNS failures, TLS handshake errors, application-layer issues ที่เครื่องมืออื่นไม่เห็น
Packet Capture Methods
| Method |
How |
Use Case |
| SPAN/Mirror Port |
Switch copy traffic จาก port/VLAN ไปอีก port |
Capture traffic บน switch (most common) |
| Network TAP |
Physical device ที่ copy traffic (inline, passive) |
Production monitoring (ไม่กระทบ traffic) |
| tcpdump on Server |
Capture บน server interface โดยตรง |
Server-side troubleshooting |
| Embedded Capture |
Capture บน router/firewall (built-in feature) |
Cisco EPC, Palo Alto packet capture, FortiGate sniffer |
| Proxy/MITM |
Intercept traffic ผ่าน proxy |
HTTPS inspection, application debugging |
| Remote Capture |
RSPAN, ERSPAN, rpcapd |
Capture จาก remote location → send to analyzer |
Wireshark
| Feature |
รายละเอียด |
| คืออะไร |
GUI-based packet analyzer ที่ใช้มากที่สุดในโลก (open source, cross-platform) |
| Live Capture |
Capture traffic แบบ real-time จาก network interface |
| File Analysis |
เปิดไฟล์ .pcap/.pcapng ที่ capture มาจากที่อื่น |
| Display Filters |
Filter packets ที่แสดง (e.g., ip.addr==10.0.0.1, tcp.port==443) |
| Protocol Decode |
Decode 3,000+ protocols (TCP, UDP, HTTP, DNS, TLS, BGP, OSPF, etc.) |
| Follow Stream |
Reconstruct TCP/UDP/TLS stream → ดู conversation ทั้งหมด |
| Statistics |
Conversations, endpoints, protocol hierarchy, IO graphs, flow graphs |
| Expert Info |
Auto-detect issues: retransmissions, RST, zero window, errors |
Wireshark Display Filters
| Filter |
Purpose |
| ip.addr == 10.0.0.1 |
ทุก packet ที่ src หรือ dst เป็น 10.0.0.1 |
| tcp.port == 443 |
HTTPS traffic (port 443) |
| dns |
DNS queries and responses |
| http.request |
HTTP requests only (GET, POST, etc.) |
| tcp.analysis.retransmission |
TCP retransmissions (packet loss indicator) |
| tcp.flags.reset == 1 |
TCP RST packets (connection resets) |
| tcp.analysis.zero_window |
Zero window (receiver buffer full) |
| frame.time_delta > 1 |
Packets with > 1 second gap (latency/delay) |
| tls.handshake |
TLS handshake messages (Client Hello, Server Hello, etc.) |
| !(arp or dns or icmp) |
Exclude ARP, DNS, ICMP (reduce noise) |
tcpdump
| Command |
Purpose |
| tcpdump -i eth0 |
Capture ทุก packet บน interface eth0 |
| tcpdump -i eth0 -w capture.pcap |
Save capture เป็นไฟล์ (เปิดด้วย Wireshark) |
| tcpdump -i eth0 host 10.0.0.1 |
Capture เฉพาะ traffic จาก/ไป 10.0.0.1 |
| tcpdump -i eth0 port 443 |
Capture เฉพาะ port 443 (HTTPS) |
| tcpdump -i eth0 -c 100 |
Capture แค่ 100 packets แล้วหยุด |
| tcpdump -i eth0 -s 0 |
Capture full packet (ไม่ truncate — default อาจ truncate) |
| tcpdump -i eth0 ‘tcp[tcpflags] & tcp-syn != 0’ |
Capture เฉพาะ TCP SYN packets |
| tcpdump -i eth0 -nn |
Don’t resolve hostnames or ports (faster output) |
Common Troubleshooting Patterns
| Pattern |
What to Look For |
Cause |
| TCP Retransmissions |
tcp.analysis.retransmission |
Packet loss (congestion, bad link, firewall drop) |
| TCP RST |
tcp.flags.reset == 1 |
Connection refused, firewall block, application crash |
| DNS Failure |
dns.flags.rcode != 0 |
NXDOMAIN (name not found), SERVFAIL (server error) |
| TLS Handshake Failure |
tls.alert |
Certificate error, cipher mismatch, expired cert |
| Slow Connection |
tcp.analysis.ack_rtt > 0.5 |
High RTT (latency), server processing delay |
| Zero Window |
tcp.analysis.zero_window |
Receiver overwhelmed (application not reading fast enough) |
| Duplicate ACKs |
tcp.analysis.duplicate_ack |
Out-of-order packets, packet loss triggering fast retransmit |
| ICMP Unreachable |
icmp.type == 3 |
Host/port unreachable, firewall ICMP reject |
Protocol Headers
| Protocol |
Key Fields |
Important Info |
| Ethernet (L2) |
Src MAC, Dst MAC, EtherType |
EtherType: 0x0800 (IPv4), 0x86DD (IPv6), 0x0806 (ARP) |
| IP (L3) |
Src IP, Dst IP, TTL, Protocol, DSCP |
Protocol: 6 (TCP), 17 (UDP), 1 (ICMP), 47 (GRE) |
| TCP (L4) |
Src Port, Dst Port, Seq, Ack, Flags, Window |
Flags: SYN, ACK, FIN, RST, PSH | Window = receive buffer |
| UDP (L4) |
Src Port, Dst Port, Length, Checksum |
Connectionless — no handshake, no retransmission |
| DNS |
Query Name, Type (A/AAAA/MX/CNAME), Response Code |
RCODE: 0 (OK), 3 (NXDOMAIN), 2 (SERVFAIL) |
| TLS |
Version, Cipher Suite, Certificate, SNI |
Client Hello → Server Hello → Certificate → Key Exchange |
ทิ้งท้าย: Packet Capture = Ground Truth of Network
Network Packet Analysis Capture: SPAN port (switch), TAP (inline), tcpdump (server), embedded (firewall/router) Wireshark: GUI analyzer, 3,000+ protocol decoders, display filters, follow stream, expert info tcpdump: CLI capture on Linux/server (write to .pcap → analyze in Wireshark) Key Filters: retransmissions, RST, DNS failures, TLS alerts, zero window, high RTT Protocol Decode: Ethernet → IP → TCP/UDP → Application (layer-by-layer analysis) Best Practice: capture at multiple points → compare → identify where problem occurs
อ่านเพิ่มเติมเกี่ยวกับ Network Troubleshooting Methodology และ Network Monitoring SNMP NetFlow ที่ siamlancard.com หรือจาก icafeforex.com และ siam2r.com


