Home » Network Observability: OpenTelemetry, Grafana และ eBPF
Network Observability: OpenTelemetry, Grafana และ eBPF
Network Observability: OpenTelemetry, Grafana และ eBPF
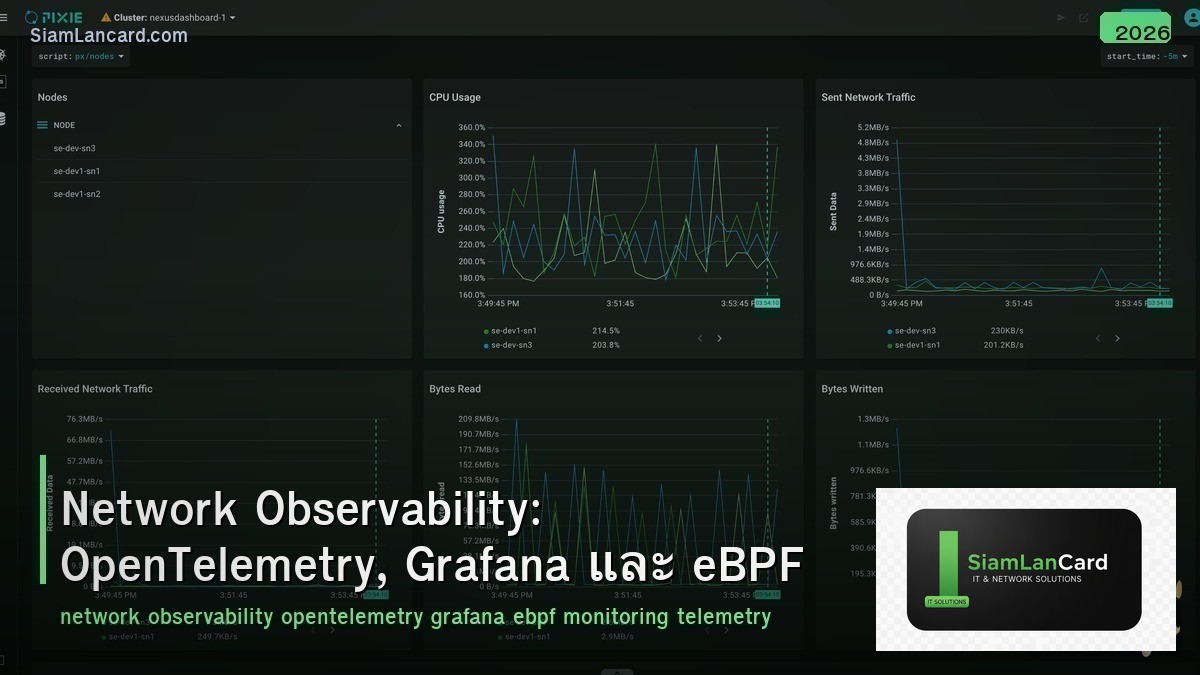
Network Observability ก้าวข้าม traditional monitoring (SNMP, ping, syslog) ไปสู่การเข้าใจ network behavior อย่างลึกซึ้งด้วย metrics, traces และ logs ที่ correlated กัน OpenTelemetry เป็น open standard สำหรับ telemetry collection, Grafana เป็น visualization platform และ eBPF เป็น Linux kernel technology ที่ให้ deep observability โดยไม่ต้อง modify applications
Traditional monitoring บอกแค่ “อะไรพัง” (what) แต่ observability บอก “ทำไมพัง” (why) ด้วย — correlate metrics (CPU, bandwidth), traces (packet path, latency per hop) และ logs (events, errors) เข้าด้วยกัน ทำให้ troubleshoot ได้เร็วขึ้นและ detect anomalies ก่อนที่จะกลายเป็น outage
Monitoring vs Observability
| Feature |
Traditional Monitoring |
Observability |
| Approach |
Check known metrics (threshold-based) |
Explore unknown unknowns (query-based) |
| Data |
Metrics + alerts |
Metrics + Traces + Logs (3 pillars) |
| Questions |
“Is X up?” “Is Y above threshold?” |
“Why is latency high?” “Where is the bottleneck?” |
| Correlation |
Manual (different tools, different dashboards) |
Automated (correlated data, single platform) |
| Proactive |
React to alerts |
Predict + prevent issues (anomaly detection) |
Three Pillars of Observability
| Pillar |
ข้อมูล |
ตัวอย่าง |
| Metrics |
Numeric measurements over time (time-series) |
CPU%, bandwidth, packet loss, latency, error rate |
| Traces |
End-to-end request path across services/hops |
Packet path through network, API call chain |
| Logs |
Discrete events with context |
Syslog, BGP state changes, firewall logs, error messages |
OpenTelemetry (OTel)
| Feature |
รายละเอียด |
| คืออะไร |
CNCF open standard สำหรับ telemetry: APIs, SDKs, Collector |
| Signals |
Metrics, Traces, Logs (all three pillars) |
| Collector |
Agent ที่ receive, process และ export telemetry data |
| Receivers |
รับ data จาก sources (OTLP, Prometheus, Jaeger, syslog, SNMP) |
| Processors |
Transform data (filter, batch, enrich, sample) |
| Exporters |
ส่ง data ไป backends (Prometheus, Jaeger, Loki, Elasticsearch) |
| Vendor Neutral |
เปลี่ยน backend ได้โดยไม่ต้องเปลี่ยน instrumentation |
Grafana Stack
| Component |
Pillar |
Purpose |
| Prometheus |
Metrics |
Time-series database + scraping (pull model) |
| Grafana |
Visualization |
Dashboards, alerts, explore (query all data sources) |
| Loki |
Logs |
Log aggregation (like Prometheus but for logs) |
| Tempo |
Traces |
Distributed tracing backend |
| Mimir |
Metrics (scale) |
Horizontally scalable Prometheus (long-term storage) |
| Alloy (Agent) |
Collection |
Telemetry collector (replaces Grafana Agent) |
eBPF
| Feature |
รายละเอียด |
| คืออะไร |
Extended Berkeley Packet Filter — run sandboxed programs ใน Linux kernel |
| Network Observability |
Capture packets, trace connections, measure latency ที่ kernel level |
| No Modification |
ไม่ต้อง modify applications หรือ install agents ใน containers |
| Performance |
Near-zero overhead (run ใน kernel, JIT compiled) |
| Use Cases |
Packet inspection, connection tracking, DNS monitoring, TLS inspection |
| Cilium |
Kubernetes CNI ที่ใช้ eBPF สำหรับ networking + security + observability |
| Hubble |
Cilium’s observability layer — network flow visibility for K8s |
Network Telemetry Sources
| Source |
Type |
Data |
| SNMP |
Metrics (poll) |
Interface stats, CPU, memory (legacy but ubiquitous) |
| Streaming Telemetry (gNMI) |
Metrics (push) |
Real-time metrics from network devices (YANG models) |
| NetFlow/sFlow/IPFIX |
Flow data |
Traffic flows (src/dst IP, port, bytes, packets) |
| Syslog |
Logs |
Device events, errors, state changes |
| BGP BMP |
Routing |
BGP route updates, peer state changes |
| Packet Capture (pcap) |
Traces |
Full packet content (Wireshark, tcpdump) |
| eBPF |
All |
Kernel-level metrics, traces, events |
Streaming Telemetry vs SNMP
| Feature |
SNMP |
Streaming Telemetry (gNMI) |
| Model |
Pull (poll every N seconds) |
Push (device streams data) |
| Resolution |
Minutes (5-min poll typical) |
Sub-second (configurable) |
| Scalability |
Limited (SNMP overhead per device) |
Better (efficient gRPC streaming) |
| Data Model |
MIBs (vendor-specific) |
YANG models (standardized) |
| Transport |
UDP (unreliable) |
gRPC over TCP/TLS (reliable) |
| Encoding |
ASN.1 (complex) |
Protocol Buffers / JSON (modern) |
Observability Tools
| Tool |
Type |
Best For |
| Grafana + Prometheus + Loki |
Open-source stack |
Full observability (metrics + logs + traces) |
| Datadog |
SaaS |
All-in-one (APM + infrastructure + logs + network) |
| Elastic (ELK) |
Open-source / Cloud |
Log analysis + search + SIEM |
| Kentik |
SaaS |
Network-specific observability (flow + SNMP + BGP) |
| ThousandEyes |
SaaS (Cisco) |
Internet + cloud path monitoring |
| Cilium + Hubble |
Open-source |
Kubernetes network observability (eBPF) |
ทิ้งท้าย: Observability = Metrics + Traces + Logs
Network Observability 3 pillars: Metrics (Prometheus), Traces (Tempo), Logs (Loki) OpenTelemetry = vendor-neutral telemetry standard (collect → process → export) Grafana = unified visualization (dashboards + alerting + explore) eBPF = kernel-level observability (zero overhead, no app modification) Streaming Telemetry (gNMI) replaces SNMP (push model, sub-second, YANG)
อ่านเพิ่มเติมเกี่ยวกับ Network Monitoring Stack และ Network Automation Ansible ที่ siamlancard.com หรือจาก icafeforex.com และ siam2r.com


