Home » Network Observability: OpenTelemetry, eBPF และ Modern Monitoring Stack
Network Observability: OpenTelemetry, eBPF และ Modern Monitoring Stack
Network Observability: OpenTelemetry, eBPF และ Modern Monitoring Stack
Network Observability ก้าวข้ามจาก traditional monitoring (แค่ดู metrics/alerts) ไปสู่การเข้าใจ “ทำไม” ปัญหาเกิดขึ้น โดยใช้ 3 pillars: Metrics, Logs และ Traces OpenTelemetry เป็น open standard สำหรับ collect telemetry data, eBPF (extended Berkeley Packet Filter) ให้ kernel-level visibility โดยไม่ต้อง modify applications และ Modern Monitoring Stack รวมเครื่องมือเหล่านี้เข้าด้วยกัน
Traditional monitoring ตอบว่า “อะไรพัง” (what) แต่ observability ตอบว่า “ทำไมพัง” (why) และ “จะพังเมื่อไหร่” (when) ในยุค microservices + cloud-native + distributed systems การ debug ปัญหาต้องการ correlation ระหว่าง metrics, logs และ traces จากหลายร้อย services — observability ทำให้เป็นไปได้
Monitoring vs Observability
| Feature |
Traditional Monitoring |
Observability |
| Question |
What is broken? |
Why is it broken? What’s the root cause? |
| Approach |
Predefined dashboards + alerts |
Explore any question on the fly |
| Data |
Metrics + basic logs |
Metrics + Logs + Traces (3 pillars) |
| Known unknowns |
Good (alert on known issues) |
Good |
| Unknown unknowns |
Poor (can’t alert on what you don’t know) |
Good (explore + correlate to discover) |
| Scale |
Works for monolith |
Required for distributed systems |
Three Pillars of Observability
| Pillar |
คืออะไร |
Use Case |
| Metrics |
Numeric time-series data (CPU, latency, error rate, throughput) |
Dashboards, alerts, trend analysis |
| Logs |
Structured/unstructured text records of events |
Detailed investigation, audit trail |
| Traces |
End-to-end request path across services (distributed tracing) |
Latency analysis, dependency mapping |
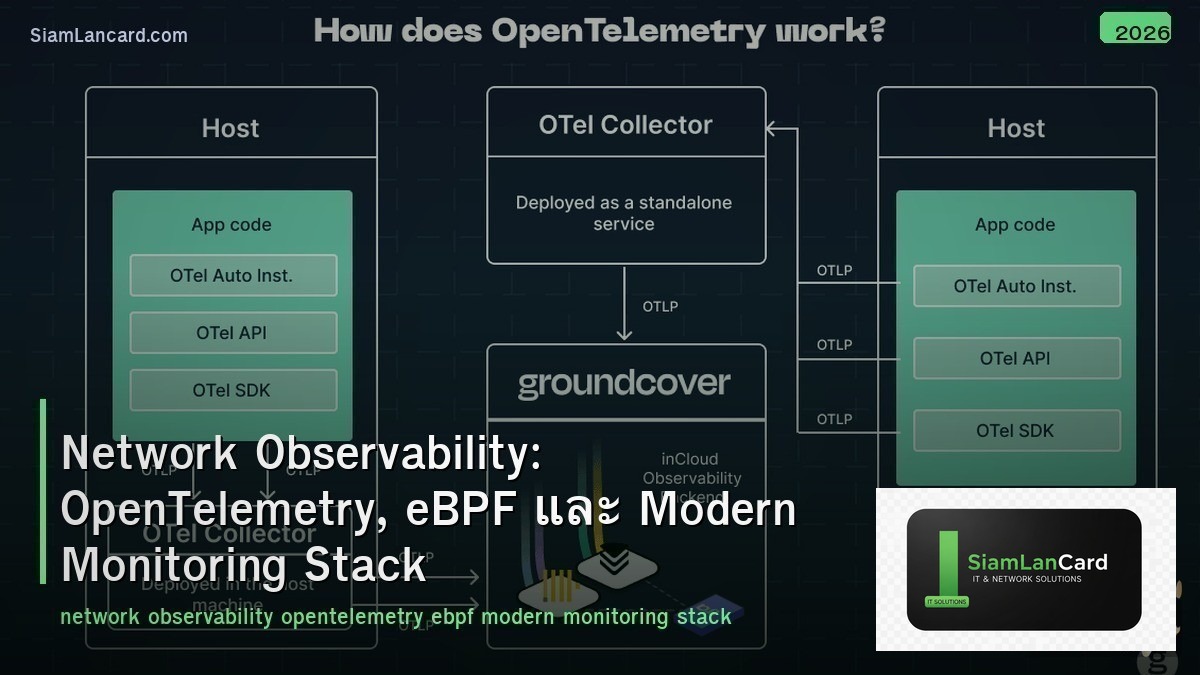
OpenTelemetry (OTel)
| Feature |
รายละเอียด |
| คืออะไร |
Open-source observability framework (CNCF project) สำหรับ collect, process, export telemetry |
| Signals |
Metrics, Logs, Traces (all 3 pillars) |
| SDKs |
Java, Python, Go, .NET, JavaScript, Ruby, PHP, C++ |
| Auto-instrumentation |
Auto-inject tracing/metrics โดยไม่ต้อง modify code (Java agent, Python auto) |
| OTel Collector |
Agent ที่ receive, process, export telemetry data (vendor-agnostic) |
| OTLP Protocol |
OpenTelemetry Protocol สำหรับ transport data (gRPC/HTTP) |
| Exporters |
Prometheus, Jaeger, Zipkin, Grafana, Datadog, New Relic, etc. |
| Vendor Neutral |
Collect once → export to any backend (no vendor lock-in) |
eBPF for Network Observability
| Feature |
รายละเอียด |
| คืออะไร |
Technology ที่ run sandboxed programs ใน Linux kernel (no kernel module needed) |
| Network Visibility |
Observe every packet, socket, connection at kernel level |
| Zero Overhead |
Minimal performance impact (runs in kernel, no context switching) |
| No Code Changes |
ไม่ต้อง modify applications — observe from kernel side |
| Use Cases |
Network monitoring, security (firewalling), tracing, profiling |
| Tools |
Cilium (networking + security), Hubble (network observability), Pixie (auto-telemetry) |
eBPF Network Tools
| Tool |
Type |
จุดเด่น |
| Cilium |
CNI + Network Policy |
eBPF-based networking, security, load balancing for Kubernetes |
| Hubble |
Network Observability |
Cilium’s observability layer (flow logs, service maps, DNS visibility) |
| Pixie |
Auto-telemetry |
Auto-instrument applications using eBPF (no SDK needed) |
| Tetragon |
Security Observability |
Runtime security + process/network event monitoring |
| Katran |
Load Balancer |
Facebook’s eBPF-based L4 load balancer (XDP) |
| bpftrace |
Tracing |
High-level tracing language for Linux (like DTrace) |
Modern Monitoring Stack
| Component |
Tool Options |
Role |
| Metrics |
Prometheus, VictoriaMetrics, Mimir |
Collect + store time-series metrics |
| Logs |
Loki, Elasticsearch, ClickHouse |
Collect + index + search logs |
| Traces |
Jaeger, Tempo, Zipkin |
Collect + store distributed traces |
| Visualization |
Grafana |
Unified dashboards (metrics + logs + traces) |
| Collection |
OTel Collector, Promtail, Fluent Bit |
Collect + forward telemetry data |
| Alerting |
Alertmanager, Grafana Alerting, PagerDuty |
Alert on conditions + escalation |
Network-Specific Observability
| Data Source |
Protocol/Method |
What It Provides |
| Flow Data |
NetFlow v9, IPFIX, sFlow |
Traffic volumes, top talkers, bandwidth usage |
| SNMP |
SNMP v2c/v3 |
Interface stats, errors, CPU/memory, device health |
| Streaming Telemetry |
gNMI, gRPC, NETCONF |
Real-time push-based telemetry (replaces SNMP polling) |
| Packet Capture |
TAP, SPAN, NPB |
Deep packet inspection, troubleshooting |
| Syslog |
Syslog, CEF |
Device logs, events, config changes |
| DNS Logs |
DNS query/response logs |
DNS visibility, threat detection |
Grafana LGTM Stack
| Component |
Role |
| Loki |
Log aggregation (like Prometheus but for logs) |
| Grafana |
Visualization + dashboards + alerting |
| Tempo |
Distributed tracing backend |
| Mimir |
Long-term metrics storage (scalable Prometheus) |
| Alloy (Agent) |
Unified telemetry collector (replaces Promtail, Grafana Agent) |
ทิ้งท้าย: Observability = Understand Why, Not Just What
Network Observability 3 Pillars: Metrics + Logs + Traces (correlated) OpenTelemetry: vendor-neutral collection (SDKs + Collector + OTLP) eBPF: kernel-level visibility (Cilium, Hubble, Pixie) — no code changes Modern stack: Prometheus (metrics) + Loki (logs) + Tempo (traces) + Grafana (visualization) Network: streaming telemetry (gNMI) replacing SNMP polling สำหรับ real-time
อ่านเพิ่มเติมเกี่ยวกับ Network TAP vs SPAN Port และ Network Packet Broker NPB ที่ siamlancard.com หรือจาก icafeforex.com และ siam2r.com


