
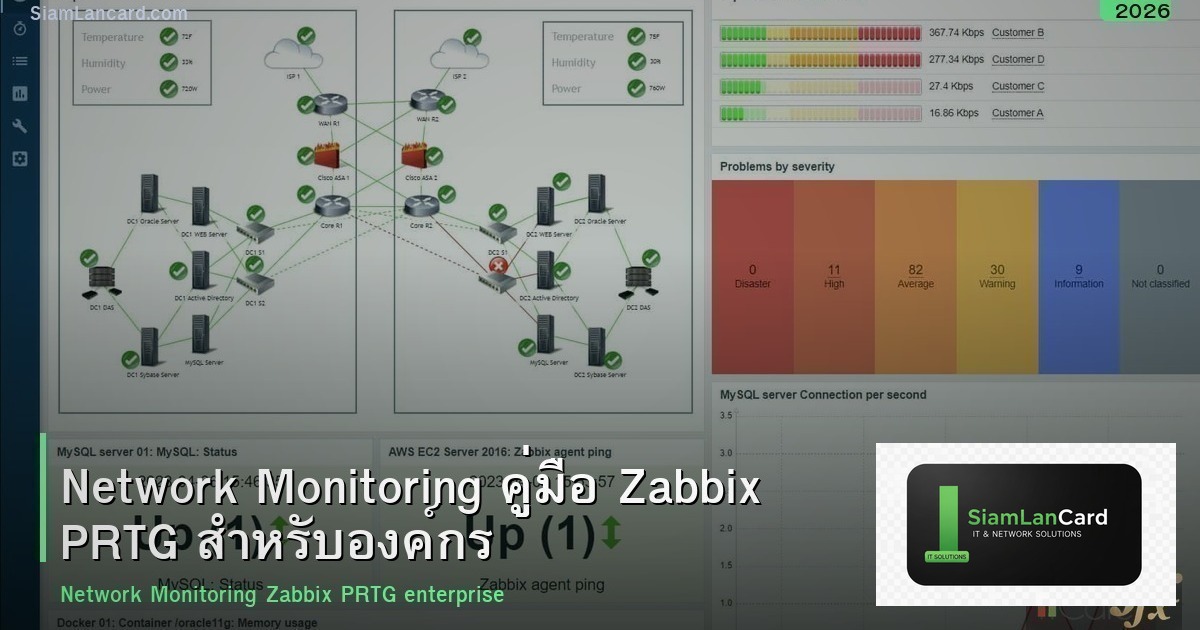
Network Monitoring คืออะไร? ทำไมองค์กรต้อง Monitor Network
Network Monitoring คือ การเฝ้าระวังอุปกรณ์และบริการ Network ทั้งหมดขององค์กร ตรวจสอบว่าทำงานปกติหรือไม่ แจ้งเตือนเมื่อมีปัญหา และเก็บข้อมูลสำหรับวิเคราะห์ ถ้าไม่มี Monitoring เมื่อ Switch ล่ม Server เต็ม Internet ช้า จะรู้ตัวเมื่อ User โทรมาแจ้ง ซึ่งช้าเกินไป Monitoring ช่วยให้รู้ปัญหาก่อน User แก้ไขได้เร็ว และวางแผน Capacity ได้
สิ่งที่ต้อง Monitor
| อุปกรณ์/บริการ | Metric ที่ Monitor | Alert เมื่อ |
|---|---|---|
| Switch/Router | Up/Down, Port Status, Bandwidth, Errors | Down, Port Error สูง |
| Server | CPU, RAM, Disk, Service Status | CPU>90%, Disk>85%, Service Down |
| Firewall | Session Count, CPU, VPN Status | Session เต็ม, VPN Down |
| Internet | Bandwidth, Latency, Packet Loss | Bandwidth เต็ม, Latency สูง |
| WiFi AP | Client Count, Signal, Channel Utilization | AP Down, Client เยอะเกิน |
| UPS | Battery Level, Load, Status | On Battery, Battery Low |
| Printer | Toner Level, Paper, Error | Toner Low, Paper Jam |
SNMP — พื้นฐานของ Network Monitoring
- คืออะไร: Simple Network Management Protocol โปรโตคอลที่อุปกรณ์ Network ใช้ส่งข้อมูลสถานะ
- วิธีทำงาน: Monitoring Server (NMS) ถาม SNMP Agent บนอุปกรณ์ ว่า CPU เท่าไหร่ Bandwidth เท่าไหร่
- Version: ใช้ SNMPv3 (เข้ารหัส) ไม่ใช้ v1/v2c (ไม่เข้ารหัส Community String เป็น Plain Text)
- SNMP Trap: อุปกรณ์ส่ง Alert มา NMS เมื่อเกิดเหตุ ไม่ต้องรอ NMS มาถาม
เลือกเครื่องมือ Monitoring
| เครื่องมือ | ราคา | จุดเด่น | เหมาะกับ |
|---|---|---|---|
| Zabbix | ฟรี (Open Source) | ครบที่สุด SNMP Agent Template เยอะ | SMB-Enterprise (IT ดูแลเอง) |
| PRTG | ฟรี 100 Sensor / $$$ | ง่ายมาก Auto-discovery Dashboard สวย | SMB ต้องการง่าย |
| LibreNMS | ฟรี (Open Source) | Auto-discovery ดี Network Focus | SMB Network Engineer |
| Grafana + Prometheus | ฟรี (Open Source) | Dashboard สวยมาก Flexible | DevOps Cloud Server |
| Nagios | ฟรี (Open Source) / $$ | เก่าแก่ Stable Plugin เยอะ | Linux Admin |
| SolarWinds | $$$ | Enterprise ครบวงจร | Enterprise 1000+ อุปกรณ์ |
วิธี Deploy Monitoring
- สำรวจอุปกรณ์: ระบุอุปกรณ์ทั้งหมดที่ต้อง Monitor IP Address SNMP Community
- ติดตั้ง NMS: ติดตั้ง Zabbix/PRTG บน Server (VM หรือ Physical)
- เปิด SNMP: เปิด SNMPv3 บนทุกอุปกรณ์ ตั้ง Username/Password
- เพิ่มอุปกรณ์: เพิ่มอุปกรณ์ใน NMS ใช้ Auto-discovery หรือเพิ่มทีละตัว
- ตั้ง Template: ใช้ Template สำหรับ Switch, Server, Firewall กำหนด Metric ที่ Monitor
- ตั้ง Alert: ตั้ง Threshold และ Alert เมื่อเกิน เช่น CPU>90% แจ้ง Email/LINE
- สร้าง Dashboard: สร้าง Dashboard แสดงภาพรวม Network สถานะอุปกรณ์
- ทดสอบ: ทดสอบ Alert ว่าทำงานจริง ปิด Interface ดู Alert มาไหม
Monitoring Best Practices
- Monitor ทุกอุปกรณ์: Switch Server Firewall AP UPS Printer ทุกชิ้น
- SNMPv3: ใช้ SNMPv3 เท่านั้น ไม่ใช้ v1/v2c
- Alert ที่สำคัญ: ตั้ง Alert เฉพาะที่สำคัญ ไม่แจ้งเตือนทุกอย่าง (Alert Fatigue)
- Escalation: Alert ส่งให้ IT ก่อน ถ้าไม่ตอบ 30 นาที Escalate ให้ Manager
- Baseline: เก็บข้อมูล Baseline ปกติ เช่น Bandwidth ปกติ 200 Mbps ถ้าเกิน 500 Mbps ผิดปกติ
- Capacity Planning: ใช้ข้อมูล Monitor วางแผน ซื้ออุปกรณ์เพิ่ม อัปเกรด Internet
- Dashboard: แสดง Dashboard บนจอ TV ในห้อง IT ดูสถานะตลอด
- Review: Review Alert และ Dashboard ทุกเช้า ตรวจสอบสิ่งผิดปกติ
สรุป Network Monitoring — รู้ปัญหาก่อน User แจ้ง
Network Monitoring เป็นพื้นฐานสำคัญของ IT องค์กร เลือก Zabbix (ฟรี) หรือ PRTG (ง่าย) เปิด SNMPv3 Monitor ทุกอุปกรณ์ ตั้ง Alert และ Dashboard หากต้องการข้อมูลเพิ่มเติม ติดตามได้ที่ SiamLanCard.com


