Home » Network Monitoring Stack: Prometheus, Grafana และ Alertmanager
Network Monitoring Stack: Prometheus, Grafana และ Alertmanager
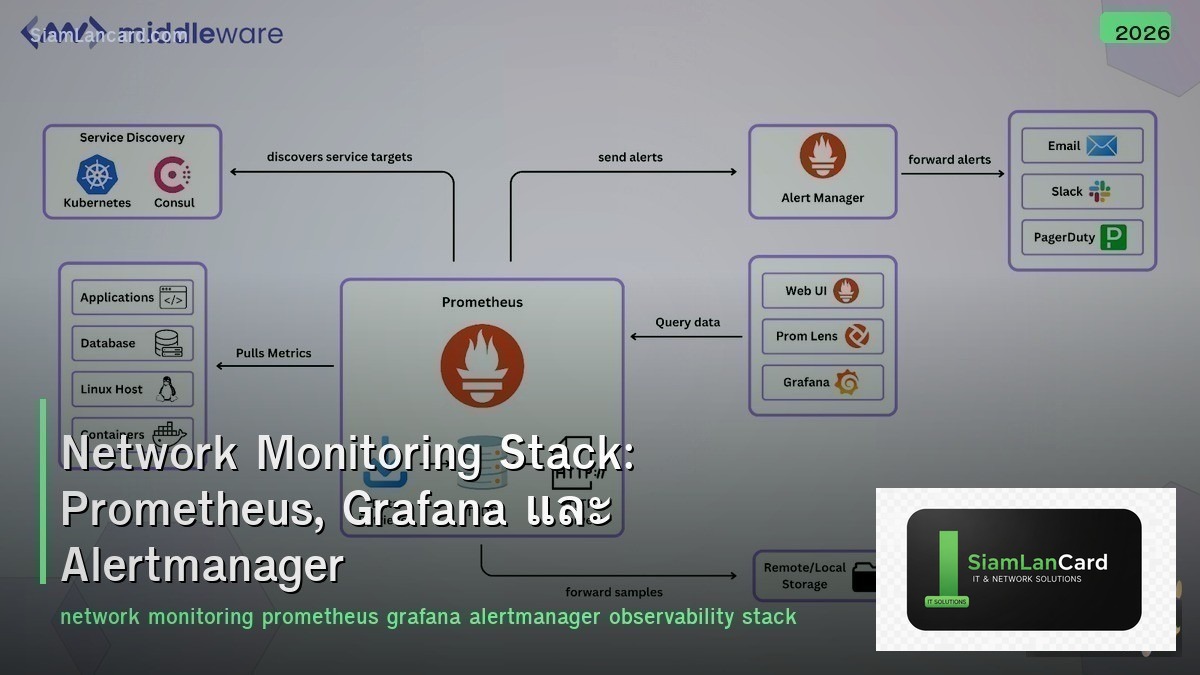
Network Monitoring Stack: Prometheus, Grafana และ Alertmanager
Prometheus + Grafana + Alertmanager เป็น open-source monitoring stack ที่ได้รับความนิยมสูงสุดในปัจจุบัน Prometheus เก็บ metrics แบบ time-series, Grafana แสดง dashboards สวยงาม และ Alertmanager จัดการ alerts ทั้ง stack ทำงานร่วมกันเพื่อให้ full observability สำหรับ network, servers และ applications
SNMP-based monitoring แบบเดิม (Nagios, Zabbix) มีข้อจำกัดในยุค cloud-native ที่ infrastructure เปลี่ยนแปลงตลอดเวลา Prometheus ใช้ pull model + service discovery ทำให้ monitor dynamic environments ได้ดี รองรับ Kubernetes, containers และ microservices โดย native
Stack Overview
| Component |
Role |
Port |
| Prometheus |
Metrics collection + storage (TSDB) + PromQL queries |
9090 |
| Grafana |
Visualization + dashboards + data source integration |
3000 |
| Alertmanager |
Alert routing + deduplication + silencing + notification |
9093 |
| Exporters |
Expose metrics from targets (node_exporter, snmp_exporter) |
Various |
| Pushgateway |
Accept metrics push จาก short-lived jobs |
9091 |
Prometheus
| Feature |
รายละเอียด |
| Data Model |
Time-series: metric_name{label1=”val”, label2=”val”} value timestamp |
| Collection |
Pull model — Prometheus scrape targets ทุก interval (default 15s) |
| Storage |
Local TSDB (ดีสำหรับ 15 days retention) + remote write สำหรับ long-term |
| PromQL |
Query language สำหรับ filter, aggregate, calculate metrics |
| Service Discovery |
Kubernetes, Consul, DNS, file-based, EC2, etc. |
| Federation |
Hierarchical Prometheus servers สำหรับ large-scale |
PromQL Examples
| Query |
ผลลัพธ์ |
| up |
ดูว่า targets ทั้งหมด up (1) หรือ down (0) |
| node_cpu_seconds_total |
Total CPU seconds per core per mode |
| rate(node_cpu_seconds_total{mode=”idle”}[5m]) |
CPU idle rate (5 min average) |
| 100 – (avg by(instance)(rate(node_cpu_seconds_total{mode=”idle”}[5m])) * 100) |
CPU usage % per instance |
| node_memory_MemAvailable_bytes / node_memory_MemTotal_bytes * 100 |
Memory available % |
| rate(node_network_receive_bytes_total[5m]) * 8 |
Network receive bits per second |
Exporters สำหรับ Network
| Exporter |
Monitor อะไร |
Port |
| node_exporter |
Linux server metrics (CPU, memory, disk, network) |
9100 |
| windows_exporter |
Windows server metrics |
9182 |
| snmp_exporter |
Network devices via SNMP (routers, switches, APs) |
9116 |
| blackbox_exporter |
Probe endpoints (HTTP, TCP, ICMP, DNS) |
9115 |
| mikrotik_exporter |
MikroTik router metrics |
9436 |
| ping_exporter |
ICMP ping latency + packet loss |
9427 |
Grafana
| Feature |
รายละเอียด |
| Data Sources |
Prometheus, InfluxDB, Elasticsearch, MySQL, PostgreSQL, CloudWatch, etc. |
| Dashboards |
Drag-and-drop panels: graphs, gauges, tables, heatmaps, logs |
| Templates |
Variables + template สำหรับ dynamic dashboards (select host, interface, etc.) |
| Alerting |
Grafana Alerting (built-in) หรือ route ไป Alertmanager |
| Community |
grafana.com/dashboards — 1000+ pre-built dashboards |
| Plugins |
Panel plugins, data source plugins, app plugins |
Alertmanager
| Feature |
รายละเอียด |
| Routing |
Route alerts ไป different receivers ตาม labels (team, severity) |
| Grouping |
Group related alerts (e.g., all alerts จาก same host) |
| Deduplication |
ไม่ส่ง alert ซ้ำ (deduplicate identical alerts) |
| Silencing |
Mute alerts ชั่วคราว (maintenance window) |
| Inhibition |
Suppress alerts เมื่อ related alert เกิดขึ้น (e.g., suppress port alerts เมื่อ device down) |
| Receivers |
Email, Slack, PagerDuty, Telegram, Webhook, OpsGenie, etc. |
Alert Rules Example
| Alert |
PromQL Condition |
Severity |
| Host Down |
up == 0 for 2m |
critical |
| High CPU |
CPU usage > 90% for 5m |
warning |
| Disk Full |
disk_available < 10% for 5m |
critical |
| High Memory |
memory_available < 10% for 5m |
warning |
| Interface Down |
ifOperStatus != 1 for 1m |
critical |
| High Bandwidth |
interface utilization > 80% for 10m |
warning |
Long-Term Storage
| Solution |
Type |
จุดเด่น |
| Thanos |
Sidecar + Store |
Global query view, S3 storage, deduplication |
| Cortex / Mimir |
Remote write |
Multi-tenant, horizontally scalable, Grafana Cloud |
| VictoriaMetrics |
Remote write |
High performance, compression, PromQL compatible |
| InfluxDB |
Remote write |
Native time-series DB, Flux query language |
Deployment Options
| Option |
วิธีทำ |
เหมาะกับ |
| Docker Compose |
prometheus + grafana + alertmanager containers |
Small-medium, quick setup |
| Kubernetes (Helm) |
kube-prometheus-stack Helm chart |
K8s environments, production |
| Ansible |
Ansible roles สำหรับ deploy + configure |
Bare-metal/VM environments |
| Grafana Cloud |
Managed Prometheus + Grafana (free tier available) |
SaaS, no maintenance |
ทิ้งท้าย: Prometheus + Grafana = Modern Monitoring
Monitoring Stack Prometheus (metrics + PromQL) + Grafana (dashboards) + Alertmanager (alerts) Exporters: node_exporter (servers) + snmp_exporter (network) + blackbox (probes) PromQL สำหรับ query + aggregate metrics Long-term: Thanos/Mimir/VictoriaMetrics สำหรับ retention > 15 days Deploy ด้วย Docker Compose หรือ kube-prometheus-stack
อ่านเพิ่มเติมเกี่ยวกับ Network Automation NETCONF YANG และ SNMP v2c v3 ที่ siamlancard.com หรือจาก icafeforex.com และ siam2r.com


