Home » Network Monitoring: SNMP v3, Prometheus และ Grafana
Network Monitoring: SNMP v3, Prometheus และ Grafana
Network Monitoring: SNMP v3, Prometheus และ Grafana
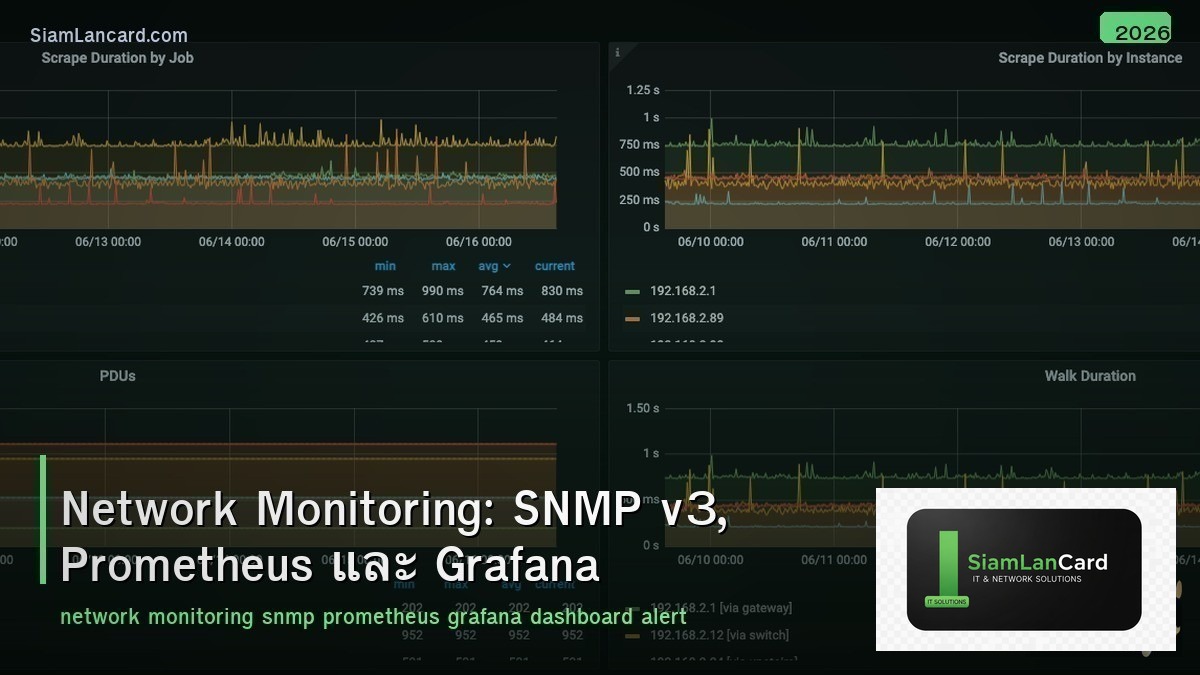
Network Monitoring เป็นกระบวนการเฝ้าดูสถานะ performance และ availability ของ network devices และ services อย่างต่อเนื่อง เพื่อตรวจจับปัญหาก่อนที่จะกระทบ users SNMP เป็นโปรโตคอลมาตรฐานสำหรับ network monitoring ส่วน Prometheus + Grafana เป็น modern monitoring stack ที่นิยมใน cloud-native environments
หลายองค์กร รู้ว่า network มีปัญหาเมื่อ users โทรมาแจ้ง ซึ่งสายเกินไป Proactive monitoring ช่วยตรวจจับปัญหา (interface down, high CPU, bandwidth saturation, errors) ก่อนที่จะกระทบ service และช่วยวางแผน capacity planning จาก historical data
Monitoring Approaches
| Approach |
วิธีทำงาน |
ตัวอย่าง |
| SNMP Polling |
NMS poll devices ทุก X วินาที |
Cacti, LibreNMS, PRTG, Zabbix |
| SNMP Traps |
Device ส่ง alert ไป NMS เมื่อเกิดเหตุ |
Interface down, high CPU, fan failure |
| Syslog |
Device ส่ง log messages ไป syslog server |
rsyslog, syslog-ng, Graylog |
| NetFlow/sFlow |
Export flow data สำหรับ traffic analysis |
ntopng, Elastiflow, SolarWinds NTA |
| Streaming Telemetry |
Device push data real-time (gNMI/gRPC) |
Telegraf + InfluxDB + Grafana |
| Prometheus (Pull) |
Prometheus scrape metrics จาก exporters |
node_exporter, snmp_exporter, blackbox |
SNMP Versions
| Version |
Authentication |
Encryption |
Security |
| SNMPv1 |
Community string (plaintext) |
ไม่มี |
ต่ำ (ไม่แนะนำ) |
| SNMPv2c |
Community string (plaintext) |
ไม่มี |
ต่ำ (ยังนิยมใช้) |
| SNMPv3 |
Username + auth (MD5/SHA) |
DES/AES |
สูง (แนะนำ) |
SNMPv3 Security Levels
| Level |
Authentication |
Encryption |
Use Case |
| noAuthNoPriv |
Username only |
ไม่มี |
Lab/test only |
| authNoPriv |
HMAC-MD5/SHA |
ไม่มี |
Internal trusted network |
| authPriv |
HMAC-SHA |
AES-128/256 |
Production (recommended) |
Key SNMP OIDs
| Metric |
OID |
MIB |
| System Uptime |
1.3.6.1.2.1.1.3.0 |
SNMPv2-MIB::sysUpTime |
| Interface Status |
1.3.6.1.2.1.2.2.1.8 |
IF-MIB::ifOperStatus |
| Interface In Octets |
1.3.6.1.2.1.2.2.1.10 |
IF-MIB::ifInOctets |
| Interface Out Octets |
1.3.6.1.2.1.2.2.1.16 |
IF-MIB::ifOutOctets |
| CPU Usage |
Vendor-specific |
CISCO-PROCESS-MIB, HOST-RESOURCES-MIB |
| Memory Usage |
Vendor-specific |
CISCO-MEMORY-POOL-MIB, HOST-RESOURCES-MIB |
| Interface Errors |
1.3.6.1.2.1.2.2.1.14 |
IF-MIB::ifInErrors |
Prometheus + Grafana Stack
| Component |
บทบาท |
| Prometheus |
Time-series database + scraper (pull metrics จาก targets) |
| Exporters |
Expose metrics ในรูปแบบที่ Prometheus อ่านได้ |
| snmp_exporter |
SNMP → Prometheus metrics (สำหรับ network devices) |
| node_exporter |
Linux server metrics (CPU, memory, disk, network) |
| blackbox_exporter |
Probe endpoints (HTTP, TCP, ICMP, DNS) |
| Alertmanager |
จัดการ alerts (dedup, group, route → email/Slack/PagerDuty) |
| Grafana |
Visualization dashboard (graphs, tables, heatmaps) |
SNMP vs Prometheus
| Feature |
SNMP |
Prometheus |
| Protocol |
UDP 161/162 |
HTTP (pull /metrics endpoint) |
| Data Model |
OID-based (hierarchical MIB) |
Label-based (key-value pairs) |
| Network Devices |
Native support (ทุก vendor) |
ผ่าน snmp_exporter |
| Servers/Apps |
Limited |
Native (exporters + instrumentation) |
| Query Language |
N/A (poll specific OIDs) |
PromQL (powerful query language) |
| Alerting |
SNMP Traps (push) |
Alertmanager (rule-based) |
| Visualization |
NMS tools (Cacti, PRTG) |
Grafana (flexible, beautiful) |
NMS Tools
| Tool |
ราคา |
จุดเด่น |
| Zabbix |
Free (open-source) |
All-in-one, SNMP + agent, auto-discovery |
| LibreNMS |
Free (open-source) |
Network-focused, auto-discovery, alerts |
| PRTG |
Free (100 sensors) / $$$ |
Easy GUI, Windows-based, many sensor types |
| Nagios/Icinga |
Free (open-source) |
Plugin-based, very flexible |
| SolarWinds NPM |
$$$ |
Enterprise, NetFlow, reporting |
| Datadog |
$$ (SaaS) |
Cloud-native, APM + infra + logs |
| Prometheus + Grafana |
Free (open-source) |
Cloud-native, PromQL, beautiful dashboards |
Alerting Best Practices
| Practice |
รายละเอียด |
| Alert on symptoms not causes |
“Service down” ดีกว่า “CPU high” (user-impact focused) |
| Set proper thresholds |
Warning 80% → Critical 90% (ไม่ alert ที่ 50%) |
| Avoid alert fatigue |
Alert เฉพาะสิ่งที่ต้อง action → ลด noise |
| Escalation |
L1 → L2 → L3 ตามเวลาที่ไม่ acknowledge |
| Runbook |
ทุก alert มี runbook อธิบายวิธี investigate + fix |
ทิ้งท้าย: Monitor = ป้องกันปัญหาก่อนเกิด
Network Monitoring = proactive vs reactive SNMPv3 (authPriv) = secure monitoring สำหรับ network devices Prometheus + Grafana = modern stack สำหรับ servers + cloud ใช้ทั้ง SNMP + Prometheus ร่วมกัน (network + server/app) Alert smart: symptoms not causes, proper thresholds, runbooks
อ่านเพิ่มเติมเกี่ยวกับ NetFlow sFlow Analysis และ Network Troubleshooting ที่ siamlancard.com หรือจาก icafeforex.com และ siam2r.com


