Home » Network Monitoring: SNMP, Syslog, NetFlow และ Monitoring Stack
Network Monitoring: SNMP, Syslog, NetFlow และ Monitoring Stack
Network Monitoring: SNMP, Syslog, NetFlow และ Monitoring Stack
Network Monitoring เป็นกระบวนการเฝ้าระวังสุขภาพและประสิทธิภาพของ network อย่างต่อเนื่อง SNMP (Simple Network Management Protocol) ใช้ poll ข้อมูลจาก devices เช่น CPU, memory, interface stats, Syslog รวบรวม log messages จากทุก device เพื่อ troubleshooting และ security analysis, NetFlow วิเคราะห์ traffic patterns และ bandwidth usage และ Modern Monitoring Stack รวมทุกอย่างเข้าด้วยกัน
Network ที่ไม่มี monitoring เหมือน ขับรถตาบอด: ไม่รู้ว่า link ไหน saturated, device ไหน CPU สูง, interface ไหน error สูง จนกว่า user จะ complain ซึ่งตอนนั้นปัญหาอาจรุนแรงแล้ว Proactive monitoring ตรวจจับปัญหาก่อนที่จะ impact users ทำให้ MTTR (Mean Time To Resolve) ลดลงอย่างมาก
Three Pillars of Network Monitoring
| Pillar |
Protocol |
Data Type |
Use Case |
| Device Health |
SNMP |
CPU, memory, interface stats, uptime |
Alert เมื่อ device มีปัญหา |
| Log Analysis |
Syslog |
Event messages, errors, warnings |
Troubleshooting, security, compliance |
| Traffic Analysis |
NetFlow/IPFIX |
Flow records (src/dst, bytes, duration) |
Bandwidth, top talkers, anomaly detection |
SNMP
| Feature |
รายละเอียด |
| Versions |
v1 (no security), v2c (bulk operations, community string), v3 (authentication + encryption) |
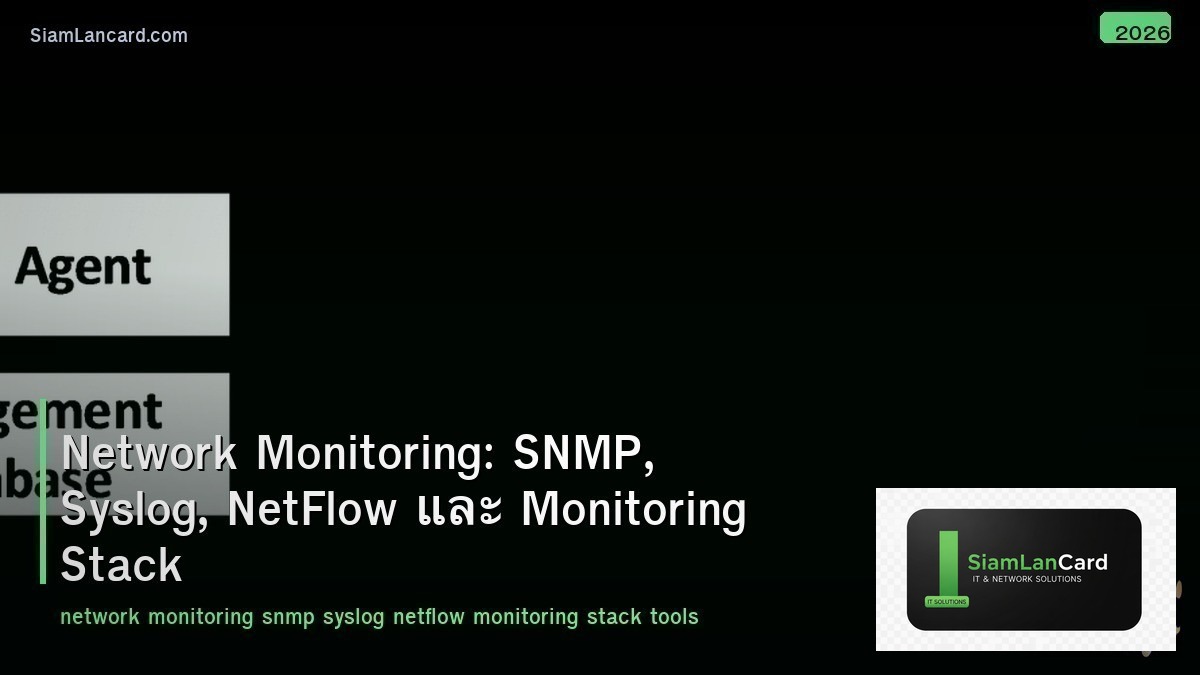
| Components |
Manager (NMS), Agent (on device), MIB (data structure) |
| Operations |
GET (poll value), SET (change config), TRAP (device → NMS alert), INFORM (acknowledged trap) |
| OID |
Object Identifier — unique ID สำหรับแต่ละ data point (e.g., 1.3.6.1.2.1.1.3 = sysUpTime) |
| MIB |
Management Information Base — database ของ OIDs ที่ device support |
| Polling Interval |
Typically 5 minutes (balance between granularity and load) |
| Port |
UDP 161 (polling), UDP 162 (traps) |
| Best Practice |
ใช้ SNMPv3 เสมอ (v2c community string = plaintext = security risk) |
Syslog
| Feature |
รายละเอียด |
| Standard |
RFC 5424 (modern), RFC 3164 (legacy BSD format) |
| Severity Levels |
0=Emergency, 1=Alert, 2=Critical, 3=Error, 4=Warning, 5=Notice, 6=Info, 7=Debug |
| Facility |
Source category: kern, user, mail, daemon, auth, local0-7 |
| Transport |
UDP 514 (traditional), TCP 514 (reliable), TLS (encrypted) |
| Format |
Timestamp + Hostname + Facility.Severity + Message |
| Central Server |
รวม logs จากทุก devices → search, correlate, alert |
| Retention |
กำหนดตาม compliance (PCI: 1 year, HIPAA: 6 years) |
| Best Practice |
ใช้ TCP/TLS (reliable + encrypted), NTP sync ทุก device |
NetFlow / IPFIX
| Feature |
รายละเอียด |
| NetFlow v5 |
Cisco original format (fixed fields, IPv4 only) |
| NetFlow v9 |
Template-based (flexible fields, IPv4 + IPv6) |
| IPFIX |
IETF standard based on NetFlow v9 (RFC 7011) — vendor neutral |
| sFlow |
Sampling-based (1 in N packets) — lower overhead, multi-vendor |
| Flow Record |
Src/Dst IP, Src/Dst Port, Protocol, Bytes, Packets, Duration, ToS |
| Use Cases |
Bandwidth analysis, top talkers, application usage, anomaly detection |
| Export Port |
UDP 2055 (NetFlow), UDP 4739 (IPFIX), UDP 6343 (sFlow) |
Monitoring Tools
| Tool |
Type |
จุดเด่น |
| Zabbix |
Open Source NMS |
SNMP + agent monitoring, templates, alerting, dashboards |
| PRTG |
Commercial NMS |
Auto-discovery, 250+ sensor types, easy setup (Windows) |
| Nagios/Icinga |
Open Source |
Plugin ecosystem, flexible alerting, community support |
| LibreNMS |
Open Source NMS |
Auto-discovery, SNMP-focused, alerting, API |
| Prometheus + Grafana |
Open Source |
Time-series metrics + beautiful dashboards (cloud-native) |
| Graylog / ELK |
Log Management |
Centralized syslog + search + dashboards + alerting |
| ntopng / Kentik |
Flow Analysis |
NetFlow/sFlow analysis, traffic visualization, DDoS detection |
| SolarWinds NPM |
Commercial NMS |
Enterprise NMS, NetFlow analyzer, config management |
Modern Monitoring Stack
| Layer |
Tool |
Role |
| Collection |
Telegraf / SNMP Exporter |
Collect SNMP, syslog, NetFlow data |
| Storage |
InfluxDB / Prometheus / Elasticsearch |
Time-series database สำหรับ metrics + logs |
| Visualization |
Grafana |
Dashboards + graphs + alerts |
| Alerting |
Grafana Alerting / PagerDuty / Slack |
Notify teams เมื่อ threshold breach |
| Log Pipeline |
Fluentd / Logstash / Vector |
Parse, filter, route logs |
Alerting Best Practices
| Practice |
รายละเอียด |
| Meaningful thresholds |
CPU > 90% 5 min → alert (ไม่ใช่ spike 1 วินาที) |
| Severity levels |
Critical (device down), Warning (high utilization), Info (config change) |
| Escalation |
L1 → L2 → L3 escalation ถ้าไม่ acknowledge ใน X minutes |
| Suppress flapping |
ป้องกัน alert flood จาก interface flapping (dampening) |
| Maintenance windows |
Suppress alerts during planned maintenance |
| Alert fatigue |
Tune alerts → actionable only (too many alerts = ignore all) |
Monitoring Design
| Tier |
What to Monitor |
Interval |
| Availability |
ICMP ping (up/down), SNMP sysUpTime |
1 minute |
| Performance |
CPU, memory, interface utilization, errors, discards |
5 minutes |
| Traffic |
NetFlow/IPFIX (bandwidth, top talkers, applications) |
Continuous (flow export) |
| Logs |
Syslog (errors, config changes, security events) |
Real-time (syslog stream) |
| Configuration |
Config backup + change detection |
Daily or on-change |
ทิ้งท้าย: If You Can’t Measure It, You Can’t Manage It
Network Monitoring SNMP: poll device health (CPU, memory, interfaces) — use v3 for security Syslog: centralized logs (errors, events, security) — use TCP/TLS + NTP sync NetFlow/IPFIX: traffic analysis (bandwidth, top talkers, anomalies) Stack: Telegraf → InfluxDB/Prometheus → Grafana (modern open-source stack) Alerting: meaningful thresholds, severity levels, escalation, suppress flapping Monitor: availability (1 min), performance (5 min), traffic (continuous), logs (real-time)
อ่านเพิ่มเติมเกี่ยวกับ Network Observability OpenTelemetry eBPF และ Network Performance Testing iPerf ที่ siamlancard.com หรือจาก icafeforex.com และ siam2r.com


