Home » Network Monitoring: SNMP, NetFlow, sFlow, Prometheus และ Grafana Dashboard
Network Monitoring: SNMP, NetFlow, sFlow, Prometheus และ Grafana Dashboard
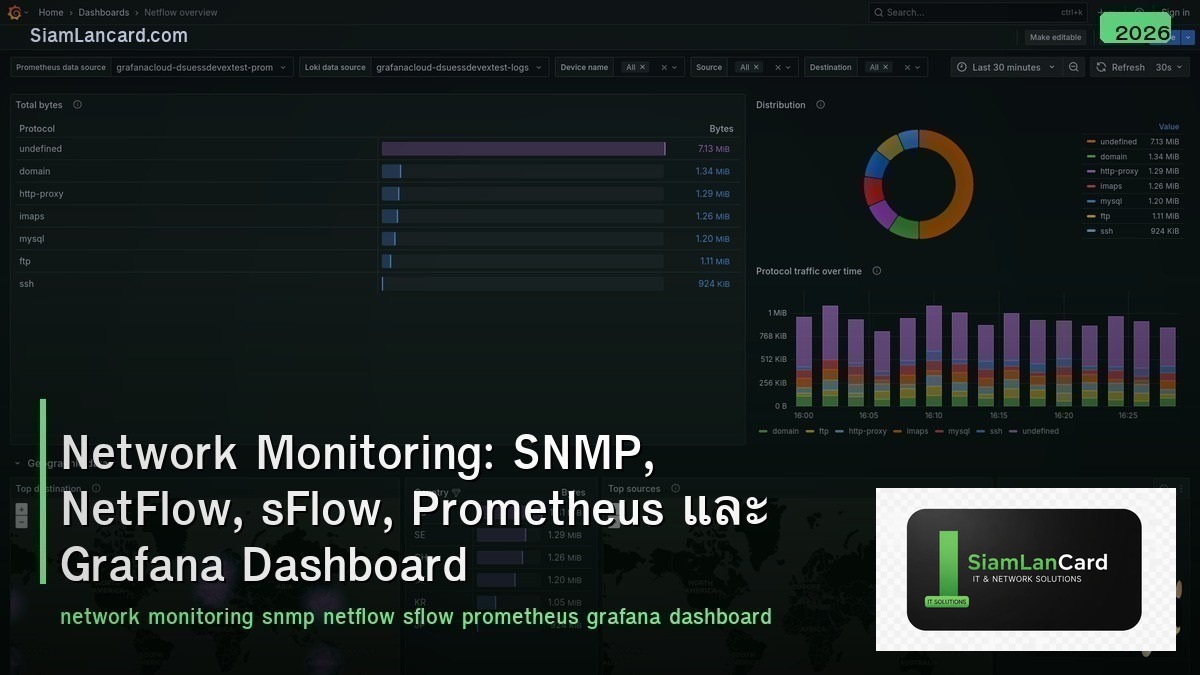
Network Monitoring: SNMP, NetFlow, sFlow, Prometheus และ Grafana Dashboard
Network Monitoring เป็นหัวใจของ network operations ที่ช่วยตรวจสอบสุขภาพและประสิทธิภาพของ network infrastructure SNMP ให้ข้อมูล device status + metrics, NetFlow/sFlow วิเคราะห์ traffic flows เพื่อ bandwidth planning และ security, Prometheus เก็บ time-series metrics จาก network devices และ Grafana สร้าง dashboards ที่สวยงามและ interactive สำหรับ real-time visibility
Network ที่ไม่มี monitoring เหมือน ขับรถโดยไม่มี dashboard: ไม่รู้ความเร็ว, ไม่รู้น้ำมันเหลือเท่าไหร่, ไม่รู้เครื่องยนต์ร้อนเกินไปหรือไม่ Proper monitoring ช่วยตรวจจับปัญหาก่อนกระทบ users, วางแผน capacity, และลด MTTR (Mean Time to Repair) ลง 50-80%
Monitoring Types
| Type |
What |
Tools |
| Availability (Up/Down) |
Device/interface alive หรือไม่ |
ICMP ping, SNMP status |
| Performance (Metrics) |
CPU, memory, bandwidth, errors, latency |
SNMP, gNMI, Prometheus |
| Traffic Analysis (Flows) |
Who talks to whom, how much, what protocol |
NetFlow, sFlow, IPFIX |
| Configuration |
Config changes, compliance check |
RANCID, Oxidized, SolarWinds NCM |
| Log Analysis |
Syslog messages, events, errors |
Syslog + ELK, Graylog, Splunk |
SNMP (Simple Network Management Protocol)
| Feature |
รายละเอียด |
| คืออะไร |
Protocol สำหรับ query/set network device parameters (RFC 1157/3416) |
| Components |
Manager (NMS) + Agent (on device) + MIB (data definitions) |
| Operations |
GET (read), SET (write), GETNEXT (walk), GETBULK (bulk read), TRAP (alert) |
| MIB (Management Information Base) |
Tree structure ของ OIDs ที่ define metrics (e.g., ifInOctets = interface bytes in) |
| OID Example |
1.3.6.1.2.1.2.2.1.10 = ifInOctets (bytes received on interface) |
| Polling |
NMS polls devices ทุก 1-5 นาที → collect metrics → store → graph |
SNMP Versions
| Version |
Security |
Features |
Recommendation |
| SNMPv1 |
Community string (plaintext) |
Basic GET/SET/TRAP |
ไม่แนะนำ (ไม่ปลอดภัย) |
| SNMPv2c |
Community string (plaintext) |
GETBULK, improved errors, 64-bit counters |
ใช้ได้ถ้า network isolated |
| SNMPv3 |
Username + Auth (MD5/SHA) + Privacy (DES/AES) |
Full security: authentication + encryption |
แนะนำ (secure) |
NetFlow / IPFIX / sFlow
| Feature |
NetFlow (v5/v9) |
IPFIX |
sFlow |
| Developer |
Cisco |
IETF (based on NetFlow v9) |
InMon (multi-vendor) |
| Method |
Flow-based (track every flow) |
Flow-based (flexible templates) |
Sampling-based (sample 1 in N packets) |
| Data |
Src/dst IP, ports, protocol, bytes, packets, interface |
Same + extensible templates |
Packet header samples + interface counters |
| Overhead |
Medium-High (track all flows) |
Medium-High |
Low (sampling reduces load) |
| Best For |
Cisco environments, detailed flow analysis |
Multi-vendor, standard |
High-speed networks, multi-vendor |
| Collector |
ntopng, Plixer, SolarWinds NTA |
ntopng, Elastic |
sFlow-RT, ntopng, InMon |
Prometheus + Grafana Stack
| Component |
Role |
รายละเอียด |
| Prometheus |
Time-series DB + scraper |
Pull metrics จาก targets ทุก 15-60 วินาที → store in TSDB |
| SNMP Exporter |
SNMP → Prometheus |
Convert SNMP OIDs → Prometheus metrics (snmp_exporter) |
| Node Exporter |
Server metrics |
CPU, memory, disk, network ของ Linux servers |
| Blackbox Exporter |
Probe endpoints |
HTTP, DNS, TCP, ICMP probes (availability + latency) |
| Alertmanager |
Alert routing |
Route alerts → email, Slack, PagerDuty, LINE |
| Grafana |
Visualization |
Dashboards, graphs, tables, heatmaps, alerts |
Key Network Metrics
| Metric |
Source |
Threshold |
| Interface Utilization |
SNMP ifInOctets/ifOutOctets |
Alert > 80% sustained |
| Interface Errors |
SNMP ifInErrors/ifOutErrors |
Alert > 0 (any errors = investigate) |
| CPU Utilization |
SNMP cpmCPUTotal5minRev (Cisco) |
Alert > 75% sustained |
| Memory Utilization |
SNMP cpmCPUMemoryUsed |
Alert > 85% |
| Latency (RTT) |
ICMP ping / IP SLA |
Alert > baseline + 2× std dev |
| Packet Loss |
ICMP ping / IP SLA |
Alert > 1% |
| BGP Peer Status |
SNMP bgpPeerState |
Alert != Established |
| Link Flaps |
Syslog / SNMP traps |
Alert > 3 flaps in 5 minutes |
Monitoring Solutions
| Solution |
Type |
จุดเด่น |
| Zabbix |
Open source |
Full-featured: SNMP, agents, web, templates, alerting |
| PRTG |
Commercial |
Easy setup, sensor-based pricing, auto-discovery |
| LibreNMS |
Open source |
Auto-discovery, SNMP-focused, community-driven |
| SolarWinds NPM |
Commercial |
Enterprise standard, NetFlow, deep Cisco integration |
| Prometheus + Grafana |
Open source |
Modern, scalable, cloud-native, Kubernetes integration |
| Datadog |
SaaS |
Cloud + on-prem, network maps, anomaly detection, AI |
| Nagios/Icinga |
Open source |
Legacy but reliable, plugin ecosystem, check-based |
Grafana Dashboard Design
| Panel |
Best For |
| Time Series Graph |
Bandwidth, CPU, memory over time (trend analysis) |
| Gauge |
Current value (CPU %, memory %, disk %) |
| Stat Panel |
Single value with sparkline (uptime, total traffic) |
| Table |
Top talkers, interface list, alert summary |
| Heatmap |
Latency distribution over time |
| Node Graph |
Network topology visualization |
| Alert List |
Active alerts and recent history |
ทิ้งท้าย: Monitor Everything, Alert on What Matters
Network Monitoring SNMP: poll devices (GET/SET/TRAP), MIB/OID-based, use SNMPv3 for security NetFlow/sFlow: traffic analysis (who talks to whom, bandwidth by app/user/protocol) Prometheus + Grafana: modern stack (SNMP exporter + time-series DB + beautiful dashboards) Key Metrics: utilization, errors, CPU, memory, latency, packet loss, BGP state Solutions: Zabbix/LibreNMS (open source), PRTG/SolarWinds (commercial), Prometheus+Grafana (cloud-native) Best Practice: monitor everything → alert only on actionable items → dashboard for context
อ่านเพิ่มเติมเกี่ยวกับ Network Observability Telemetry gNMI และ Network Troubleshooting Methodology ที่ siamlancard.com หรือจาก icafeforex.com และ siam2r.com


