
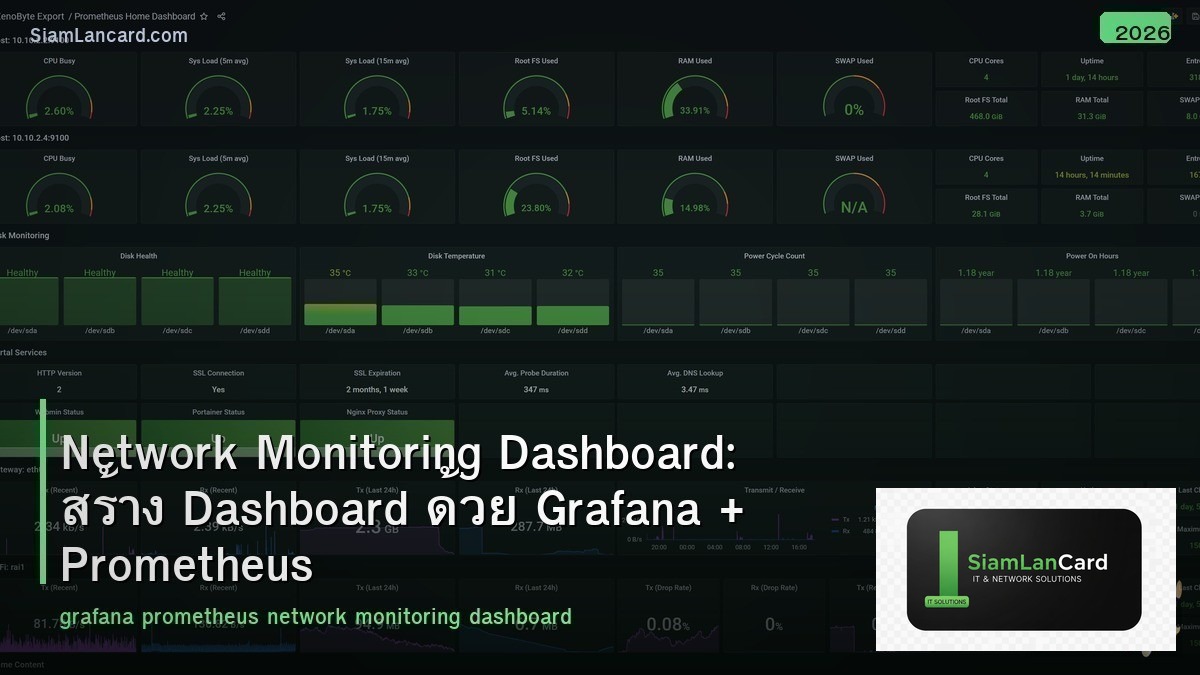
Network Monitoring Dashboard: สร้าง Dashboard ด้วย Grafana + Prometheus
Grafana + Prometheus เป็น open-source stack ที่นิยมใช้สำหรับ network monitoring ให้ visualization ที่สวยงาม real-time alerts และ flexible queries Prometheus เก็บ metrics data (time-series database) ส่วน Grafana แสดงผลเป็น dashboards ที่ interactive
เมื่อเทียบกับ commercial solutions เช่น PRTG, SolarWinds ที่ราคาแพง Grafana + Prometheus เป็นทางเลือกฟรี ที่ powerful ไม่แพ้กัน รองรับ SNMP, NetFlow, API และ custom metrics บทความนี้จะสอนวิธี setup ตั้งแต่ต้นจนมี dashboard สำหรับ monitor network
Architecture Overview
| Component | หน้าที่ | Port |
|---|---|---|
| Prometheus | Time-series database เก็บ metrics | 9090 |
| Grafana | Visualization + dashboards + alerts | 3000 |
| SNMP Exporter | แปลง SNMP data เป็น Prometheus metrics | 9116 |
| Node Exporter | เก็บ metrics ของ Linux servers | 9100 |
| Blackbox Exporter | Probe endpoints (ping, HTTP, DNS, TCP) | 9115 |
| Alertmanager | จัดการ alerts (email, Slack, LINE) | 9093 |
Data Flow
Network Devices → SNMP Exporter → Prometheus → Grafana Servers → Node Exporter → Prometheus → Grafana Services → Blackbox Exporter → Prometheus → Grafana Alerts → Prometheus → Alertmanager → Email/Slack/LINE
Installation
Docker Compose (แนะนำ)
docker-compose.yml สำหรับ deploy ทั้ง stack: version: ‘3’ services: prometheus: image: prom/prometheus ports: [“9090:9090”] volumes: [./prometheus.yml:/etc/prometheus/prometheus.yml] grafana: image: grafana/grafana ports: [“3000:3000”] volumes: [grafana-data:/var/lib/grafana] snmp-exporter: image: prom/snmp-exporter ports: [“9116:9116”] node-exporter: image: prom/node-exporter ports: [“9100:9100”] blackbox-exporter: image: prom/blackbox-exporter ports: [“9115:9115”] volumes: grafana-data:
Prometheus Configuration
prometheus.yml
ตั้งค่า scrape targets: global: scrape_interval: 30s scrape_configs: – job_name: ‘snmp’ static_configs: – targets: [‘10.0.0.1’, ‘10.0.0.2’, ‘10.0.0.3’] metrics_path: /snmp params: module: [if_mib] relabel_configs: – source_labels: [__address__] target_label: __param_target – target_label: __address__ replacement: snmp-exporter:9116 – job_name: ‘node’ static_configs: – targets: [‘server1:9100’, ‘server2:9100’] – job_name: ‘blackbox’ metrics_path: /probe params: module: [icmp] static_configs: – targets: [‘10.0.0.1’, ‘8.8.8.8’, ‘google.com’] relabel_configs: – source_labels: [__address__] target_label: __param_target – target_label: __address__ replacement: blackbox-exporter:9115
SNMP Exporter
Monitor Network Devices
SNMP Exporter แปลง SNMP OIDs เป็น Prometheus metrics: ifHCInOctets → ifHCInOctets (bytes in) ifHCOutOctets → ifHCOutOctets (bytes out) ifOperStatus → ifOperStatus (1=up, 2=down) sysUpTime → sysUpTime (uptime in ticks) hrProcessorLoad → CPU utilization Default module (if_mib) ครอบคลุม interface metrics ทั่วไป สร้าง custom module ด้วย snmp_exporter generator สำหรับ OIDs เฉพาะ
Grafana Dashboards
Dashboard ที่ควรมี
| Dashboard | แสดงอะไร | Grafana ID |
|---|---|---|
| Network Overview | สรุป status ของ devices ทั้งหมด (up/down) | Custom |
| Interface Traffic | Bandwidth utilization ของแต่ละ interface | 11190 |
| Device Health | CPU, Memory, Temperature ของ switches/routers | Custom |
| Uptime/Availability | Uptime SLA ของ devices และ services | Custom |
| Node Exporter Full | Server metrics (CPU, RAM, Disk, Network) | 1860 |
| Blackbox Probes | Ping latency, HTTP response time, DNS | 7587 |
Panels ที่ใช้บ่อย
Time Series: แสดง traffic, latency, CPU over time Gauge: แสดง current utilization (%, Mbps) Stat: แสดงตัวเลขเดียว (uptime, total devices) Table: แสดง list ของ interfaces, devices Heatmap: แสดง patterns over time Alert List: แสดง active alerts
PromQL Queries
| ต้องการ | PromQL |
|---|---|
| Interface traffic (bps) | rate(ifHCInOctets{ifDescr=”Gi0/1″}[5m]) * 8 |
| Interface utilization (%) | rate(ifHCInOctets[5m]) * 8 / ifHighSpeed / 10000 |
| Interface status (up/down) | ifOperStatus == 1 |
| Ping latency | probe_duration_seconds{job=”blackbox”} |
| Ping success | probe_success{job=”blackbox”} |
| CPU utilization | hrProcessorLoad |
| Server CPU | 100 – (avg by(instance)(rate(node_cpu_seconds_total{mode=”idle”}[5m])) * 100) |
Alerting
Prometheus Alert Rules
ตัวอย่าง alert rules: groups: – name: network rules: – alert: InterfaceDown expr: ifOperStatus != 1 for: 2m labels: severity: critical annotations: summary: “Interface down on {{ $labels.instance }}” – alert: HighBandwidth expr: rate(ifHCInOctets[5m]) * 8 / ifHighSpeed / 10000 > 80 for: 5m labels: severity: warning annotations: summary: “Bandwidth > 80% on {{ $labels.ifDescr }}”
Notification Channels
| Channel | Setup |
|---|---|
| SMTP config ใน Alertmanager | |
| Slack | Webhook URL |
| LINE Notify | LINE Notify token + webhook |
| Microsoft Teams | Incoming Webhook connector |
| PagerDuty | Integration key |
ทิ้งท้าย: Grafana + Prometheus คือ Best Free Monitoring Stack
Grafana + Prometheus ให้ monitoring ระดับ enterprise ฟรี deploy ด้วย Docker Compose ภายใน 30 นาที เริ่มจาก SNMP Exporter + Blackbox Exporter แล้วค่อยเพิ่ม import dashboards จาก grafana.com (ไม่ต้องสร้างเอง)
อ่านเพิ่มเติมเกี่ยวกับ SNMP Monitoring และ NetFlow sFlow Traffic Analysis ที่ siamlancard.com หรือจาก icafeforex.com และ siam2r.com


