Home » Network Forensics: Packet Capture, Wireshark Analysis, NetFlow Forensics และ Incident Response
Network Forensics: Packet Capture, Wireshark Analysis, NetFlow Forensics และ Incident Response
Network Forensics: Packet Capture, Wireshark Analysis, NetFlow Forensics และ Incident Response
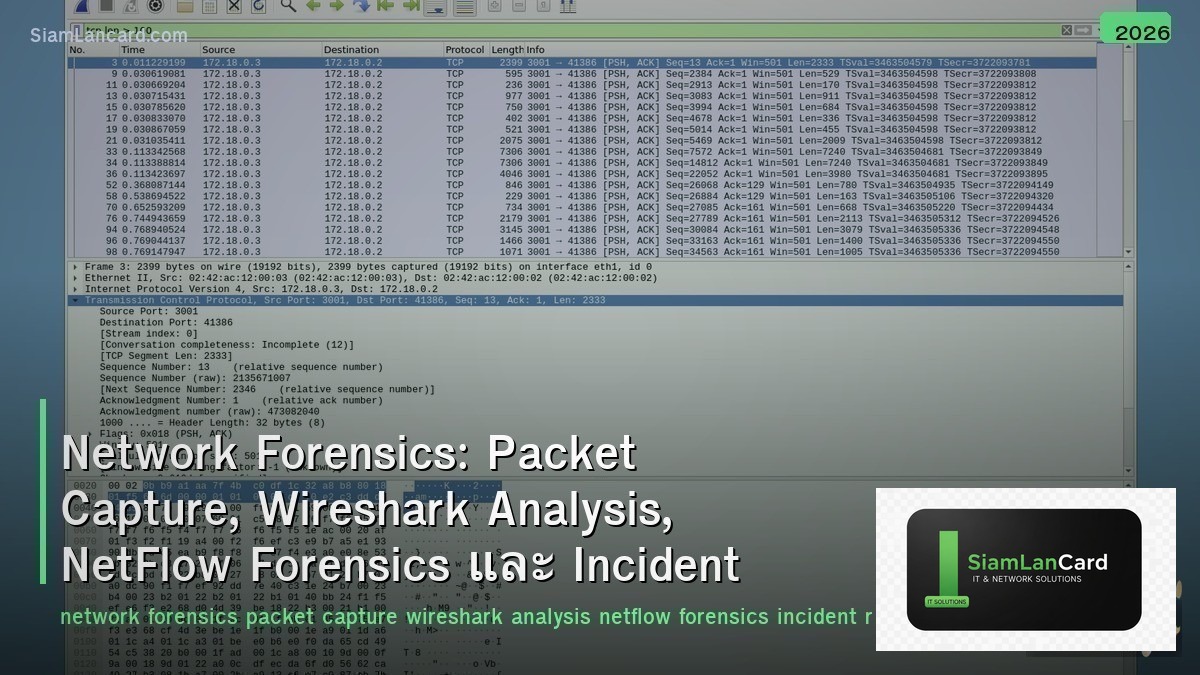
Network Forensics วิเคราะห์ network traffic เพื่อตรวจสอบ security incidents และรวบรวมหลักฐาน Packet Capture บันทึกทุก packet ที่ผ่าน network, Wireshark Analysis วิเคราะห์ packets แบบละเอียดถึง protocol level, NetFlow Forensics ใช้ flow data วิเคราะห์ patterns และตรวจจับ anomalies และ Incident Response ใช้ network evidence ในการตอบสนองต่อ security incidents อย่างเป็นระบบ
เมื่อเกิด security incident องค์กรต้องตอบคำถามว่า “เกิดอะไรขึ้น เมื่อไหร่ อย่างไร”: attacker เข้ามาทาง vector ไหน, exfiltrate data อะไรบ้าง, lateral movement ไปถึงไหน, ยังอยู่ใน network หรือไม่ Network forensics ให้คำตอบเหล่านี้ผ่าน packet captures และ flow data — network traffic ไม่โกหก
Network Forensics Data Sources
| Source |
Detail Level |
Storage |
Use Case |
| Full Packet Capture (PCAP) |
สูงสุด (ทุก byte) |
สูงมาก (1 Gbps = ~10 TB/day) |
Deep analysis, malware extraction, content reconstruction |
| NetFlow/IPFIX |
ปานกลาง (flow metadata) |
ต่ำ (1% ของ PCAP) |
Traffic patterns, anomaly detection, timeline |
| DNS Logs |
ปานกลาง (queries/responses) |
ต่ำ |
C2 detection, data exfil via DNS, domain analysis |
| Proxy/Firewall Logs |
ปานกลาง (connections + URLs) |
ปานกลาง |
Web activity, blocked connections, policy violations |
| IDS/IPS Alerts |
สูง (triggered events) |
ต่ำ |
Known attack signatures, anomalous behavior |
Packet Capture Methods
| Method |
How |
Best For |
| SPAN/Mirror Port |
Switch copy traffic จาก source port ไป monitor port |
Quick setup, single switch (อาจ drop packets ถ้า oversubscribed) |
| Network TAP |
Hardware device ที่ copy traffic 100% (passive, inline) |
Production monitoring (no packet loss, no latency impact) |
| RSPAN/ERSPAN |
Remote SPAN ข้าม switches (ERSPAN = over GRE tunnel) |
Capture traffic จาก remote switches |
| tcpdump |
Command-line packet capture on Linux/network devices |
Quick capture, scripting, embedded devices |
| Wireshark |
GUI packet capture + analysis (libpcap/npcap) |
Interactive analysis, protocol decoding |
| Network Recorder |
Dedicated appliance ที่ capture + store (Endace, Gigamon) |
Full packet capture at scale (10G-100G) |
Wireshark Analysis Techniques
| Technique |
How |
Finding |
| Display Filters |
ip.addr==10.0.0.1 && tcp.port==443 |
Focus บน specific host/port/protocol |
| Follow Stream |
Right-click → Follow TCP/HTTP Stream |
ดู conversation ทั้งหมดระหว่าง 2 hosts |
| Statistics → Conversations |
ดู top talkers (most bytes/packets) |
หา data exfiltration (large outbound transfers) |
| Statistics → Protocol Hierarchy |
ดู protocol breakdown (%) |
Unusual protocols = suspicious (IRC, custom ports) |
| Export Objects |
File → Export Objects → HTTP/SMB/TFTP |
Extract transferred files (malware, documents) |
| IO Graph |
Statistics → IO Graph (traffic over time) |
Detect spikes, periodic beaconing (C2 callback) |
| DNS Analysis |
dns filter → ดู queries ที่ผิดปกติ |
DNS tunneling (long subdomain names), DGA domains |
NetFlow Forensics
| Analysis |
What to Look For |
Indicator |
| Beaconing |
Regular periodic connections ไป external IP |
C2 callback (every 60s, 300s — consistent interval) |
| Data Exfiltration |
Large outbound data transfers ไป unusual destinations |
High bytes out, after hours, to foreign IPs |
| Lateral Movement |
Internal host → scan/connect หลาย internal hosts |
Many flows from one host to many internal IPs (port scan) |
| Port Anomalies |
Unusual ports or protocols |
SSH on port 443, DNS on non-53 port, high-numbered ports |
| Long Connections |
Connections ที่อยู่นานผิดปกติ |
Persistent C2 tunnel, data siphoning |
| GeoIP Analysis |
Connections ไปยัง unusual countries |
Traffic to sanctioned countries, VPN exit nodes, hosting providers |
Incident Response with Network Evidence
| IR Phase |
Network Forensics Role |
| 1. Detection |
IDS alerts, NetFlow anomalies, DNS alerts → identify potential incident |
| 2. Scoping |
Flow data → determine affected hosts, lateral movement extent, timeline |
| 3. Containment |
Block C2 IPs/domains, isolate affected segments (firewall rules from flow analysis) |
| 4. Evidence Collection |
PCAP + NetFlow + logs → preserve evidence (chain of custody) |
| 5. Analysis |
Wireshark deep-dive → extract malware, reconstruct attack path, identify IOCs |
| 6. Eradication |
Remove attacker access based on network IOCs (IPs, domains, user agents) |
| 7. Recovery |
Monitor network สำหรับ re-infection (watch for same IOCs returning) |
| 8. Lessons Learned |
Improve detection rules based on findings → update IDS/firewall signatures |
Network Forensics Tools
| Tool |
Type |
Use |
| Wireshark |
Packet analyzer (GUI) |
Deep packet analysis, protocol decoding, file extraction |
| tcpdump |
Packet capture (CLI) |
Quick capture on servers/devices, scripting |
| tshark |
Wireshark CLI version |
Automated packet analysis, scripting, batch processing |
| NetworkMiner |
Network forensics tool |
Auto-extract files, images, credentials from PCAP |
| Zeek (Bro) |
Network security monitor |
Generate structured logs from traffic (conn.log, dns.log, http.log) |
| Arkime (Moloch) |
Full packet capture + search |
Large-scale PCAP storage + SPI (Session Profile Information) search |
| SiLK |
NetFlow analysis suite |
Large-scale flow analysis, baselining, anomaly detection |
ทิ้งท้าย: Network Forensics = The Network Never Lies
Network Forensics Data Sources: PCAP (deepest), NetFlow (patterns), DNS logs, proxy/firewall logs, IDS alerts Capture: SPAN/TAP (best), tcpdump, Wireshark, network recorders (Endace, Gigamon) Wireshark: display filters, follow stream, conversations, protocol hierarchy, export objects, IO graph NetFlow: beaconing (C2), data exfiltration, lateral movement, port anomalies, long connections, GeoIP IR: detection → scoping (flow) → containment → evidence → analysis (PCAP) → eradication → recovery Tools: Wireshark, tcpdump, Zeek (logs), Arkime (full PCAP search), NetworkMiner, SiLK Key: capture + retain network data — it’s the most reliable evidence source for incident response
อ่านเพิ่มเติมเกี่ยวกับ Network Monitoring SNMP NetFlow Telemetry และ Network Troubleshooting Methodology Tools ที่ siamlancard.com หรือจาก icafeforex.com และ siam2r.com


