Home » Network Capacity Planning: Bandwidth, Throughput และ Forecasting
Network Capacity Planning: Bandwidth, Throughput และ Forecasting
Network Capacity Planning: Bandwidth, Throughput และ Forecasting
Network Capacity Planning เป็นกระบวนการวิเคราะห์ปริมาณ traffic ปัจจุบัน คาดการณ์ growth ในอนาคต และวางแผนขยาย bandwidth/infrastructure ให้เพียงพอ เพื่อ maintain performance ที่ดีและหลีกเลี่ยง congestion การ plan ที่ดีช่วยลดค่าใช้จ่าย (ไม่ over-provision) และป้องกัน outage (ไม่ under-provision)
หลายองค์กร รอจนกว่า network จะช้า แล้วค่อยแก้ปัญหาแบบ reactive ซึ่งทำให้ users ได้รับ poor experience และการ upgrade ฉุกเฉินมีค่าใช้จ่ายสูง Proactive capacity planning ช่วยให้ upgrade ล่วงหน้า plan budget ได้ และ maintain consistent performance
Key Metrics
| Metric |
ความหมาย |
หน่วย |
| Bandwidth |
Maximum capacity ของ link (theoretical max) |
bps (Mbps, Gbps) |
| Throughput |
Actual data transferred per unit time |
bps (actual ≤ bandwidth) |
| Utilization |
% ของ bandwidth ที่ใช้อยู่ (throughput/bandwidth) |
% (target: ≤70-80%) |
| Latency |
เวลาที่ packet ใช้เดินทาง end-to-end |
ms (milliseconds) |
| Jitter |
Variation ของ latency |
ms |
| Packet Loss |
% ของ packets ที่หาย |
% (target: < 0.1%) |
| Concurrent Sessions |
จำนวน sessions พร้อมกัน |
sessions/connections |
| Packets per Second (PPS) |
จำนวน packets ที่ process ต่อวินาที |
pps (kpps, Mpps) |
Utilization Thresholds
| Utilization |
สถานะ |
Action |
| 0-50% |
Normal |
ไม่ต้อง action (มี headroom เพียงพอ) |
| 50-70% |
Warning |
Monitor ใกล้ชิด + plan upgrade |
| 70-80% |
Alert |
Schedule upgrade ภายใน 3-6 เดือน |
| 80-90% |
Critical |
Upgrade urgently (congestion เริ่มเกิด) |
| 90%+ |
Overloaded |
Emergency upgrade (packet loss, latency spike) |
Bandwidth Estimation
| Application |
Bandwidth per User/Session |
หมายเหตุ |
| Email |
50-100 Kbps |
Bursty (low average) |
| Web Browsing |
1-5 Mbps |
Bursty (varies by content) |
| VoIP Call |
80-100 Kbps |
Constant (G.711 = 80 Kbps per call) |
| Video Conference (HD) |
2-4 Mbps |
Constant (Zoom/Teams = 2.5 Mbps) |
| Video Conference (4K) |
8-15 Mbps |
High quality video |
| File Transfer |
10-100 Mbps |
Bursty (peak during transfers) |
| Cloud Apps (SaaS) |
2-5 Mbps |
Office 365, Salesforce, etc. |
| Backup/Replication |
10-1000 Mbps |
Scheduled (off-peak) |
Forecasting Methods
| Method |
วิธีทำ |
เหมาะกับ |
| Linear Trend |
Plot traffic growth → extrapolate linear trend |
Steady growth (most common) |
| Exponential Growth |
Compound growth rate (CAGR) |
Fast-growing environments |
| Seasonal Analysis |
วิเคราะห์ patterns ตาม season/time |
Retail (peak ช่วง sale), education |
| Business-Driven |
คำนวณจาก planned growth (new users, apps, sites) |
Known expansion plans |
| Rule of Thumb |
20-30% growth per year (general IT traffic) |
Quick estimation |
Monitoring Tools
| Tool |
Method |
จุดเด่น |
| PRTG |
SNMP, NetFlow, WMI |
All-in-one, easy setup, good dashboards |
| Zabbix |
SNMP, agent, traps |
Open-source, highly customizable |
| SolarWinds NPM |
SNMP, NetFlow, Packet |
Enterprise, capacity planning reports |
| LibreNMS |
SNMP, syslog |
Open-source, auto-discovery |
| Grafana + InfluxDB |
SNMP/Telegraf |
Beautiful dashboards, flexible |
| ntopng |
Packet capture, NetFlow |
Deep traffic analysis |
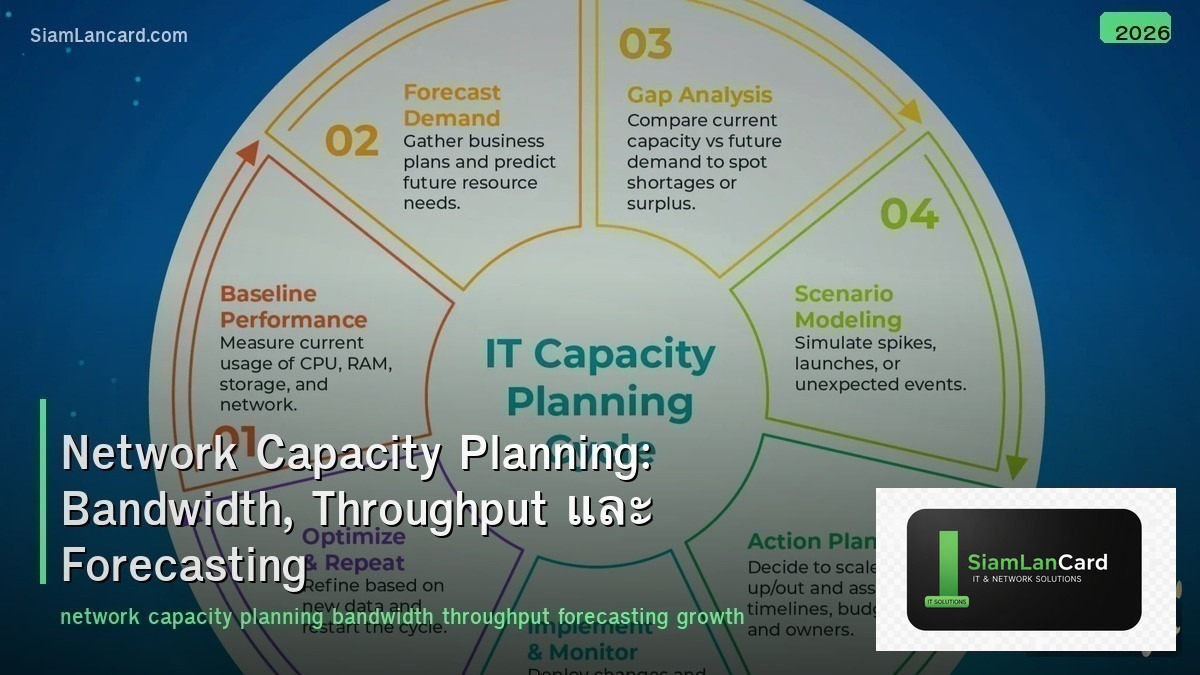
Capacity Planning Process
| Phase |
Action |
| 1. Baseline |
วัด traffic patterns ปัจจุบัน (peak, average, utilization per link) |
| 2. Analyze Trends |
วิเคราะห์ growth trend ย้อนหลัง 6-12 เดือน |
| 3. Business Input |
รับข้อมูล planned changes (new users, apps, sites, cloud migration) |
| 4. Forecast |
คำนวณ future demand (trend + business input) |
| 5. Gap Analysis |
เปรียบเทียบ future demand vs current capacity → identify gaps |
| 6. Plan Upgrades |
กำหนด upgrade timeline + budget + options |
| 7. Review |
Review plan ทุก quarter (adjust ตาม actual growth) |
WAN vs LAN Planning
| Feature |
LAN |
WAN/Internet |
| Cost per Mbps |
ต่ำมาก (switch upgrade) |
สูง (monthly recurring cost) |
| Upgrade Lead Time |
สั้น (swap cable/switch) |
ยาว (ISP provisioning 2-8 สัปดาห์) |
| Typical Utilization Target |
< 50% (cheap to over-provision) |
< 70-80% (expensive) |
| Key Metric |
PPS, port speed |
Throughput, latency, burst |
Best Practices
| Practice |
รายละเอียด |
| Monitor 24/7 |
SNMP polling ทุก 5 นาที สำหรับ utilization data |
| Alert at 70% |
Alert เมื่อ utilization > 70% sustained (5-min average) |
| Quarterly review |
Review capacity plan ทุก quarter |
| Budget ahead |
Include bandwidth upgrades ใน annual budget |
| QoS |
ใช้ QoS prioritize critical traffic เมื่อ bandwidth limited |
| Historical data |
เก็บ historical traffic data ≥ 12 เดือน สำหรับ trend analysis |
ทิ้งท้าย: Plan Ahead, Not After Outage
Capacity Planning = measure → analyze → forecast → upgrade Utilization target: ≤ 70-80% (WAN), ≤ 50% (LAN) Forecast: trend analysis + business input + 20-30% growth/year Monitor 24/7 + alert at 70% + review quarterly QoS สำหรับ prioritize traffic เมื่อ bandwidth limited
อ่านเพิ่มเติมเกี่ยวกับ Network Monitoring SNMP และ QoS Quality of Service ที่ siamlancard.com หรือจาก icafeforex.com และ siam2r.com


