
Network Capacity Planning: วางแผน Bandwidth และ Resource ให้เพียงพอ
Network Capacity Planning คือกระบวนการวิเคราะห์และคาดการณ์ความต้องการ bandwidth, throughput และ resources ของ network ในอนาคต เพื่อให้มั่นใจว่า infrastructure สามารถรองรับ traffic ที่เพิ่มขึ้นได้โดยไม่เกิดปัญหา performance
หลายองค์กร ไม่ได้วางแผน capacity ล่วงหน้า รอจนกว่า network จะช้าหรือล่มแล้วค่อยแก้ ทำให้ต้อง upgrade แบบเร่งด่วน (ราคาแพง downtime สูง) Capacity planning ที่ดีช่วยให้ upgrade ได้ล่วงหน้า ลดค่าใช้จ่ายและ downtime บทความนี้จะสอนวิธีทำ network capacity planning อย่างเป็นระบบ
ทำไมต้อง Capacity Planning
| ไม่ทำ Capacity Planning | ทำ Capacity Planning |
|---|---|
| Network ช้าเมื่อ users เพิ่ม | Network รองรับ growth ได้ |
| Emergency upgrade (แพง) | Planned upgrade (ถูกกว่า) |
| Downtime จาก congestion | Proactive prevention |
| ไม่รู้ว่าต้อง upgrade เมื่อไหร่ | รู้ล่วงหน้า 6-12 เดือน |
| Over-provisioning (เสียเงินเกิน) | Right-sizing (ใช้เงินพอดี) |
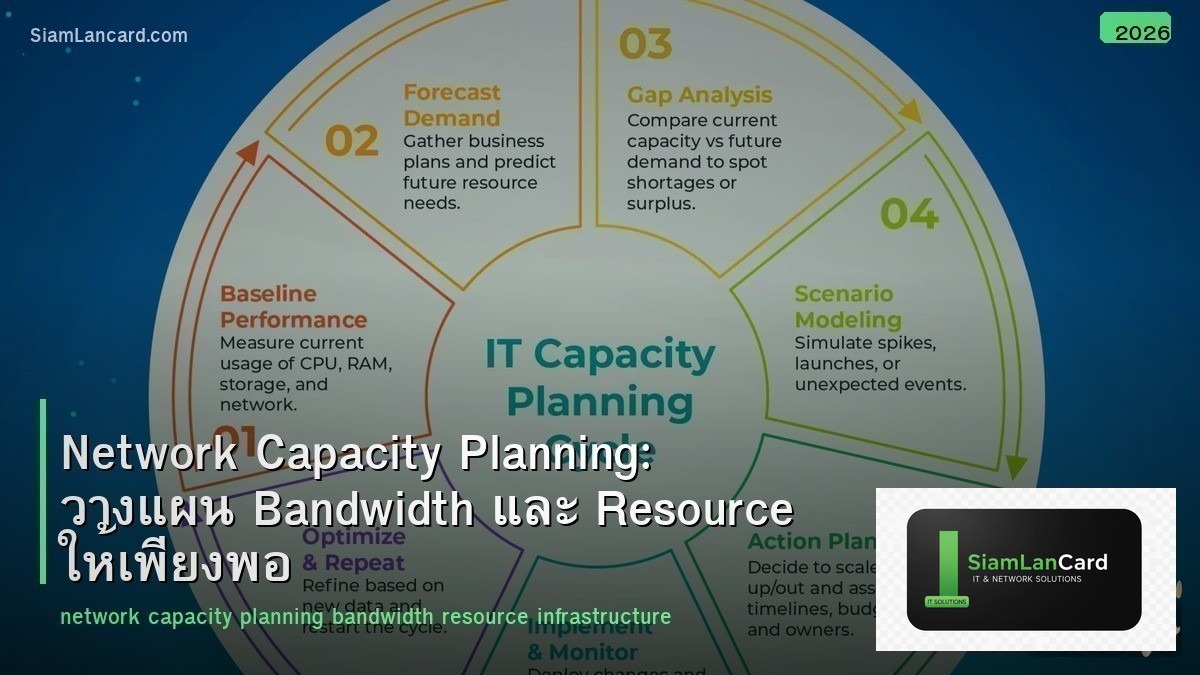
Capacity Planning Process
4 ขั้นตอน
Step 1: Baseline — วัด current utilization เก็บข้อมูล bandwidth utilization ของทุก link (peak, average, 95th percentile) เก็บข้อมูล device resources (CPU, memory, sessions) ระบุ bottlenecks ที่มีอยู่ ใช้ SNMP + monitoring tools (Zabbix, PRTG, Grafana)
Step 2: Trend Analysis — วิเคราะห์แนวโน้ม วิเคราะห์ growth rate ของ bandwidth usage (เดือนต่อเดือน, ปีต่อปี) ระบุ seasonal patterns (เช่น usage สูงช่วงสิ้นเดือน) คาดการณ์ว่า utilization จะถึง threshold เมื่อไหร่
Step 3: Demand Forecasting — คาดการณ์ความต้องการ รวม business growth plans (เพิ่มพนักงาน, เปิดสาขาใหม่) New applications (video conferencing, cloud migration) Technology changes (WiFi 6E, IoT expansion) คำนวณ bandwidth ที่ต้องเพิ่ม
Step 4: Planning & Budget — วางแผนและงบประมาณ กำหนด upgrade timeline ประมาณค่าใช้จ่าย (hardware, licenses, WAN links) เสนอ budget ล่วงหน้า 6-12 เดือน
Metrics ที่ต้องเก็บ
| Metric | วิธีเก็บ | Threshold |
|---|---|---|
| Bandwidth Utilization | SNMP ifInOctets/ifOutOctets | Warning: 70%, Critical: 85% |
| CPU Utilization | SNMP cpmCPUTotal5minRev | Warning: 60%, Critical: 80% |
| Memory Utilization | SNMP ciscoMemoryPoolUsed | Warning: 70%, Critical: 85% |
| Concurrent Sessions | Firewall session table | Warning: 70% ของ max sessions |
| Wireless Client Count | WLC SNMP/API | Warning: 70% ของ max clients per AP |
| Packet Loss | IP SLA, ping monitoring | Warning: 0.5%, Critical: 1% |
| Latency | IP SLA, ping monitoring | Warning: 50ms, Critical: 100ms |
Bandwidth Calculation
วิธีคำนวณ
Per-User Bandwidth: Office worker (email, web, file sharing): 2-5 Mbps Power user (video calls, large files): 5-15 Mbps Developer (cloud tools, CI/CD, VMs): 10-20 Mbps VoIP call: 100 Kbps per call Video conference (HD): 2-4 Mbps per session Video conference (4K): 8-15 Mbps per session
ตัวอย่างคำนวณ
| ประเภท | จำนวน | BW/คน | Concurrency | Total |
|---|---|---|---|---|
| Office workers | 200 | 3 Mbps | 70% | 420 Mbps |
| Power users | 50 | 10 Mbps | 70% | 350 Mbps |
| VoIP calls | 100 | 0.1 Mbps | 30% | 3 Mbps |
| Video conf | 30 | 4 Mbps | 50% | 60 Mbps |
| Server backup | – | – | off-hours | 500 Mbps (scheduled) |
| Total Peak | 833 Mbps |
แนะนำ: เผื่อ headroom 30-50% → ต้องการ WAN link ~1.2 Gbps
Growth Forecasting
Linear vs Exponential
Linear Growth: bandwidth เพิ่ม X Mbps ต่อเดือน (สม่ำเสมอ) เหมาะสำหรับ mature networks ที่ growth คงที่ Exponential Growth: bandwidth เพิ่ม X% ต่อเดือน (เร่งขึ้นเรื่อยๆ) เหมาะสำหรับ networks ที่กำลังเติบโตเร็ว (startup, cloud migration) วิธีคำนวณ: ถ้า current usage = 500 Mbps, growth rate = 5%/เดือน 6 เดือน: 500 × (1.05)^6 = 670 Mbps 12 เดือน: 500 × (1.05)^12 = 898 Mbps ถ้า link = 1 Gbps → จะถึง 85% threshold ใน ~10 เดือน → ต้องวางแผน upgrade
Tools
| Tool | ประเภท | ใช้ทำอะไร |
|---|---|---|
| Grafana + Prometheus | Open-source | Dashboard, trend analysis, alerting |
| PRTG | Commercial | Bandwidth monitoring, capacity reports |
| SolarWinds NPM | Commercial | Capacity planning, forecasting |
| NetFlow Analyzer | Commercial/Open-source | Application-level bandwidth analysis |
| ntopng | Open-source | Real-time traffic analysis, DPI |
Reporting
Monthly Capacity Report
ทุกเดือนควรมี report ที่ระบุ: Current utilization ของ critical links (WAN, core, DC) Trend vs last month/last year Top talkers (applications, users) Links ที่ใกล้ถึง threshold Recommended actions + timeline + budget
ทิ้งท้าย: Capacity Planning ช่วยลดค่าใช้จ่ายและ Downtime
Capacity Planning เป็น proactive approach ที่ดีกว่า reactive เริ่มจาก baseline → trend analysis → demand forecasting → planning เก็บ metrics ด้วย SNMP + monitoring tools ทำ monthly capacity report อย่ารอจน network ล่มค่อยแก้
อ่านเพิ่มเติมเกี่ยวกับ Network Monitoring Grafana Prometheus และ QoS Quality of Service ที่ siamlancard.com หรือจาก icafeforex.com และ siam2r.com


